7. Animation
There will be times when you want to highlight a data point on a chart. Animation is a helpful technique to point out important information in a chart.
The video below shows the use of animation to annotate a chart.
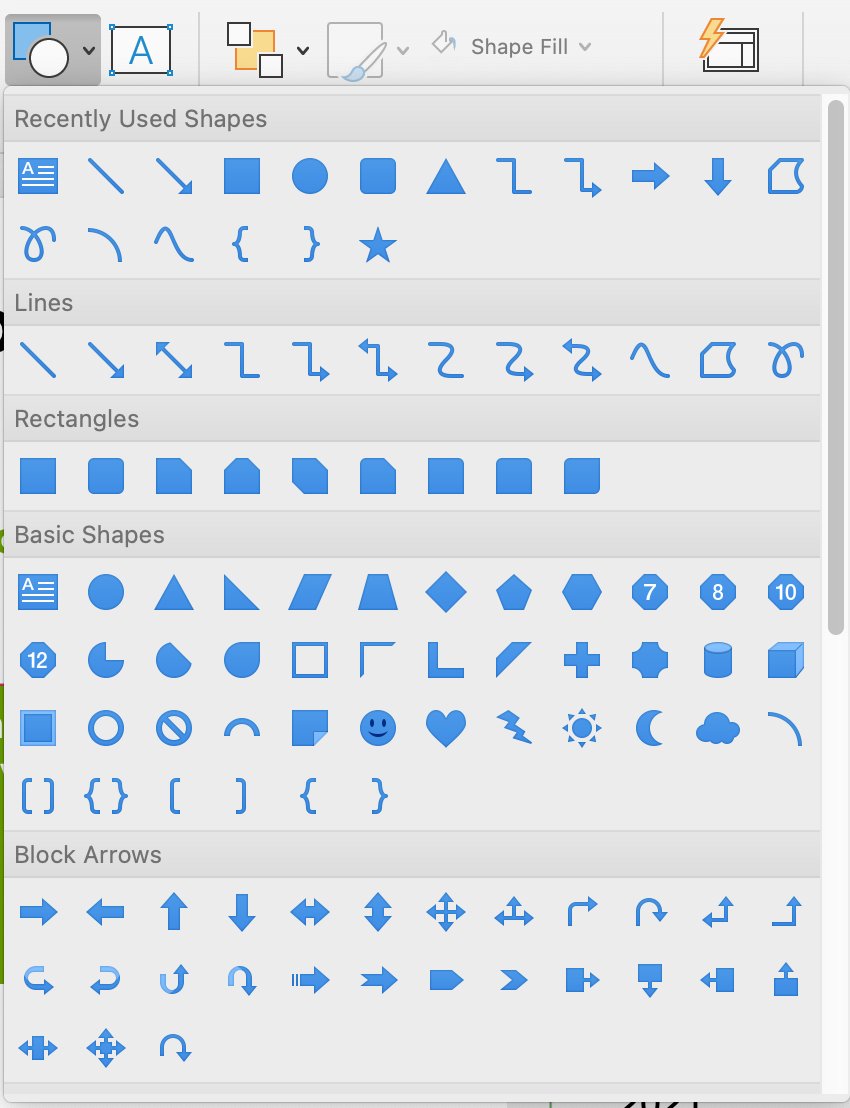
To animate an annotation, select and add a shape from the shapes menu; see Figure 7.1.
Figure 7.1: The available shape options in PowerPoint.
- Customize the shape by removing the color fill and increasing the outline’s weight
- Next, move the shape to the appropriate location on the slide and size it to highlight the data point correctly
- Select the shape and click on the Animations toolbar; see Figure 7.2
- Select the Appear animation style for a simple effect
- Finally, test your animation by putting your PowerPoint in the slideshow view
Figure 7.2: The animation toobar in PowerPoint.
It is important to note that the animation will not appear for printed PowerPoint documents. Therefore you will need to prepare an alternative way of showing the information through a series of slides.
Module 1
-
About Design Principles
-
1Chart Format
-
2Color
-
3Text, Labels, and Legends
-
4Readability
-
Test Your Knowledge
-
5Scales
-
6Data Integrity
-
7Chart Junk
-
8Data Density
-
9Data Richness
-
10Attribution
-
Test Your Knowledge
-
Exercise 1: Build a Vertical Bar
-
Exercise 2: Build a Line Chart
-
Exercise 3: Build a Waterfall Chart


