9. Data Richness
Data richness refers to the data quality and how much data is necessary to provide an accurate picture.
Data quality
High-quality data comes from a reputable source. Data is likely to be trustworthy when:
- it is from a source you recognize;
- a description of the variables and their dimensions are provided;
- the methodology used to source the data is provided; and
- the date on which the data was collected is published.
Level of detail
Well-formatted data is presented in columns and rows, with each column being a variable and each row being an observation. It is vital to understand the granularity of your data to ensure you can accurately answer the questions you have about your data.
For example, each row of data may represent a customer and their total purchases over the past year. This type of data is referred to as aggregate data. It does not mean the individual purchases by each customer over the year but rather the sum of their purchases. This type of data has a low level of granularity.
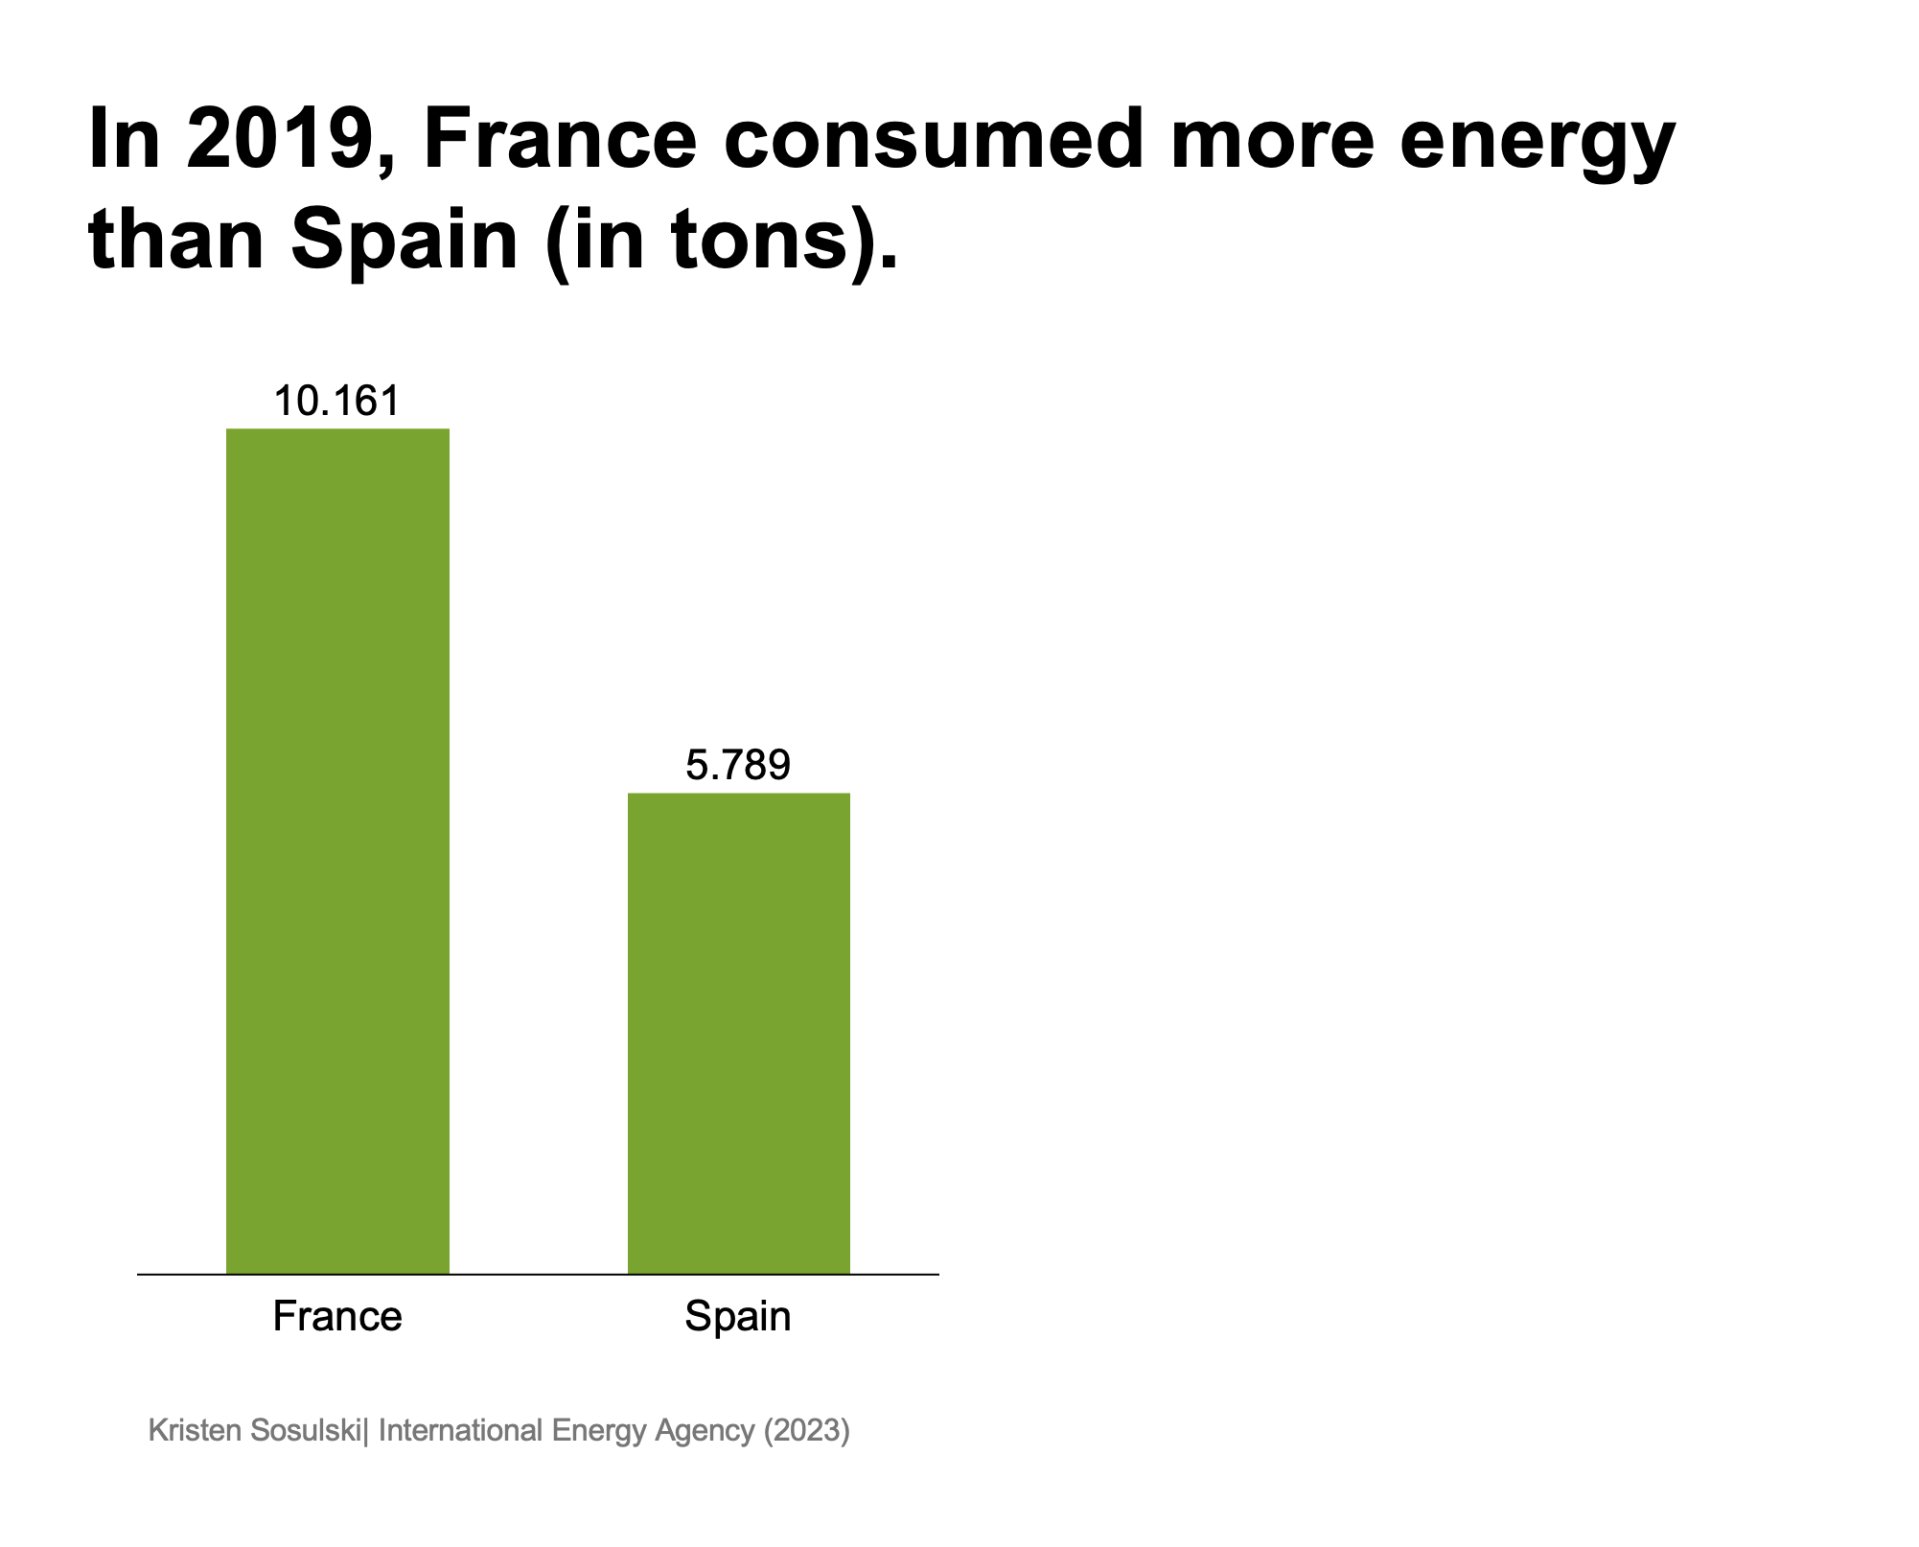
For example, review Figure 9.1 for an illustration of a chart with a low level of granularity. This chart can only answer this question: “Who consumed more energy in 2019?”
Figure 9.1: A chart using data with a low level of detail.
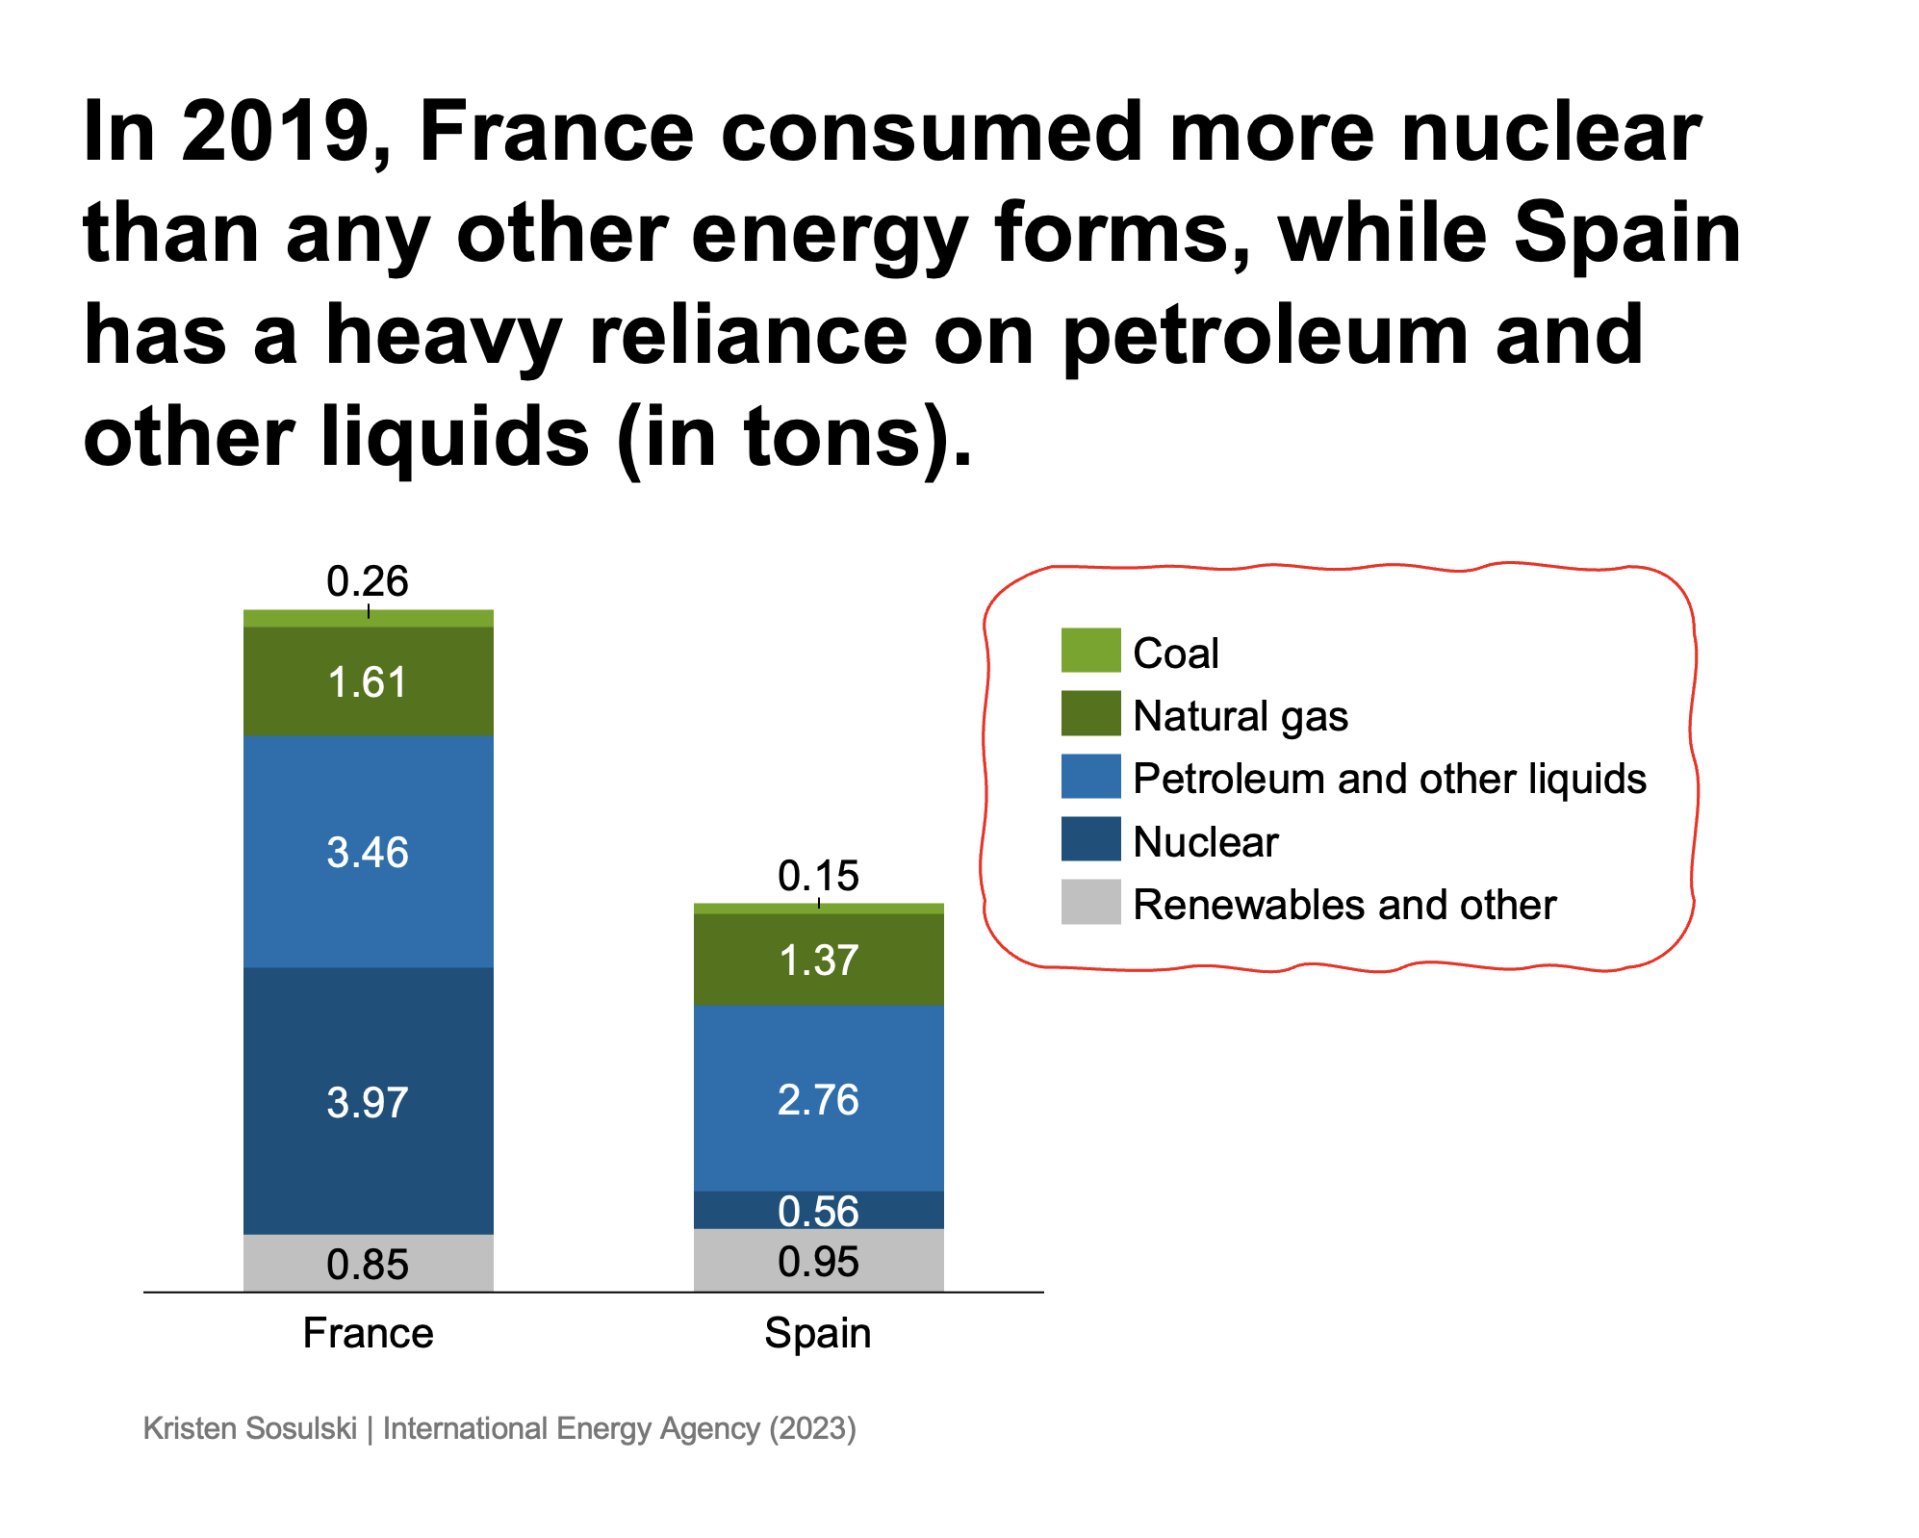
On the other hand, if the data contained types of energy consumed by each country, this would provide more detail. Therefore, this type of data would have a higher level of granularity.
For example, review Figure 9.2 for an illustration of a chart with a high level of granularity. In contrast to Figure 9.1, this chart can answer a more detailed question: “How do France and Spain compare in the forms of their energy consumption (in tons) in 2019?”
Figure 9.2: A chart that shows a more granular level of detail concerning the types of energy consumption
Module 1
-
About Design Principles
-
1Chart Format
-
2Color
-
3Text, Labels, and Legends
-
4Readability
-
Test Your Knowledge
-
5Scales
-
6Data Integrity
-
7Chart Junk
-
8Data Density
-
9Data Richness
-
10Attribution
-
Test Your Knowledge
-
Exercise 1: Build a Vertical Bar
-
Exercise 2: Build a Line Chart
-
Exercise 3: Build a Waterfall Chart

