5. Scales
Natural increments
Use natural increments for your x-axis and y-axis scales.
Examples include:
- 0, 1, 2, 3, 4, 5
- 0, 2, 4, 6, 8, 10
- 25, 50, 75, 100
- 0, 100, 200, 300,400
- 0, 1,000, 2,000, 3,000
Abbreviating forms
Use the most significant increment when using abbreviated forms.
Common abbreviated forms include:
| Number | Abbreviation |
|---|---|
| Thousand | K |
| Million | M |
| Billion | B |
| Trillion | T |
Minimum and maximum axes boundaries
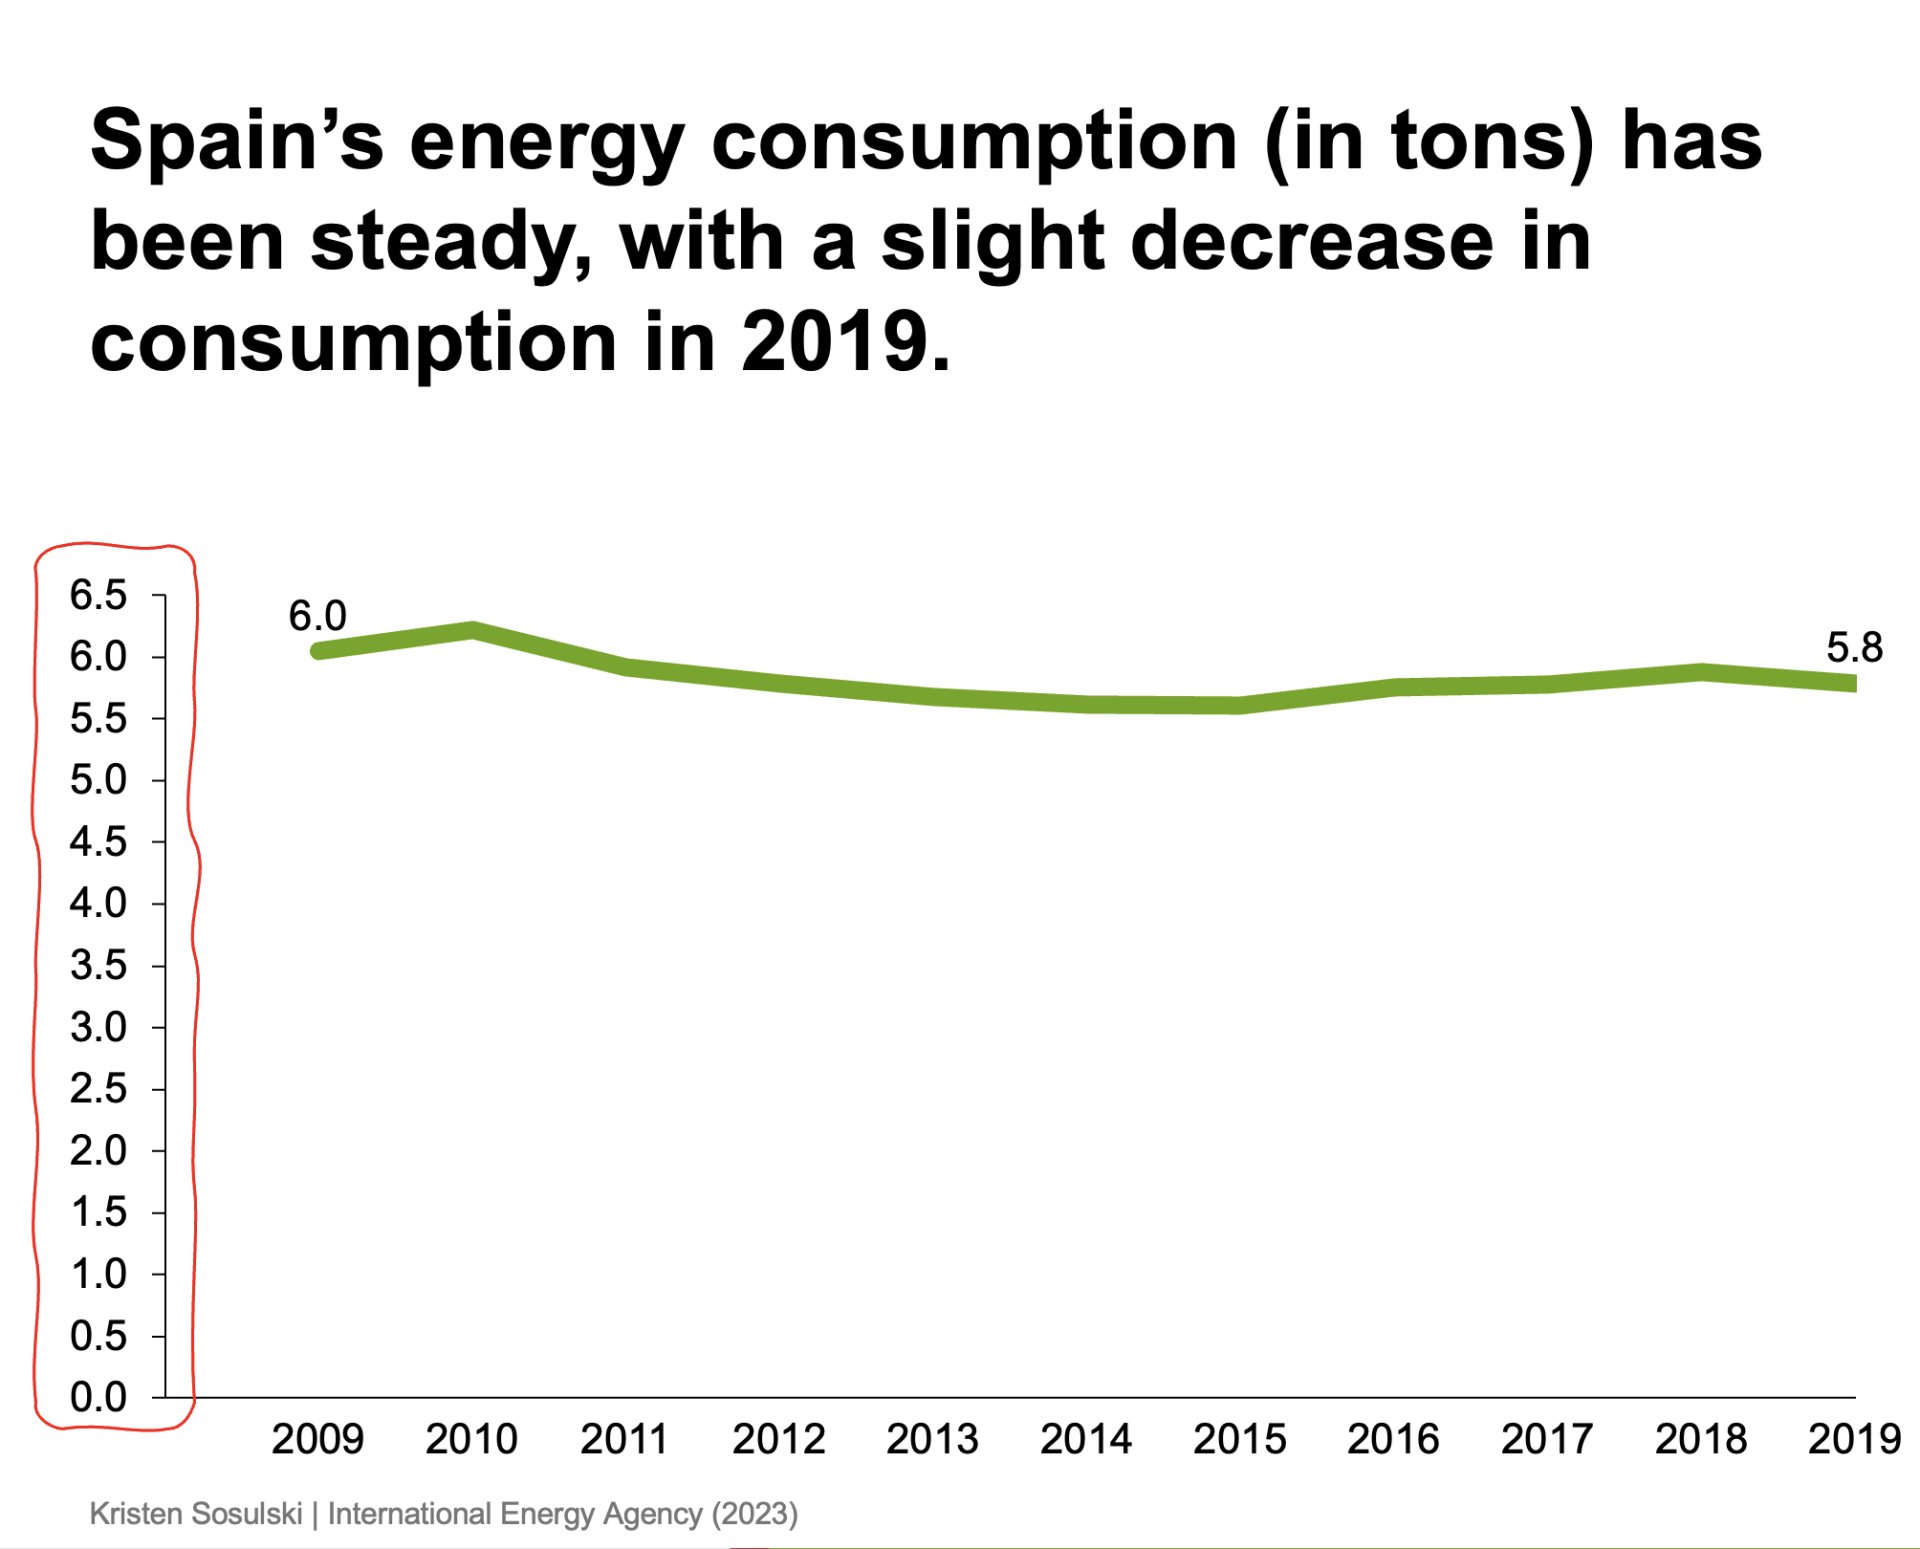
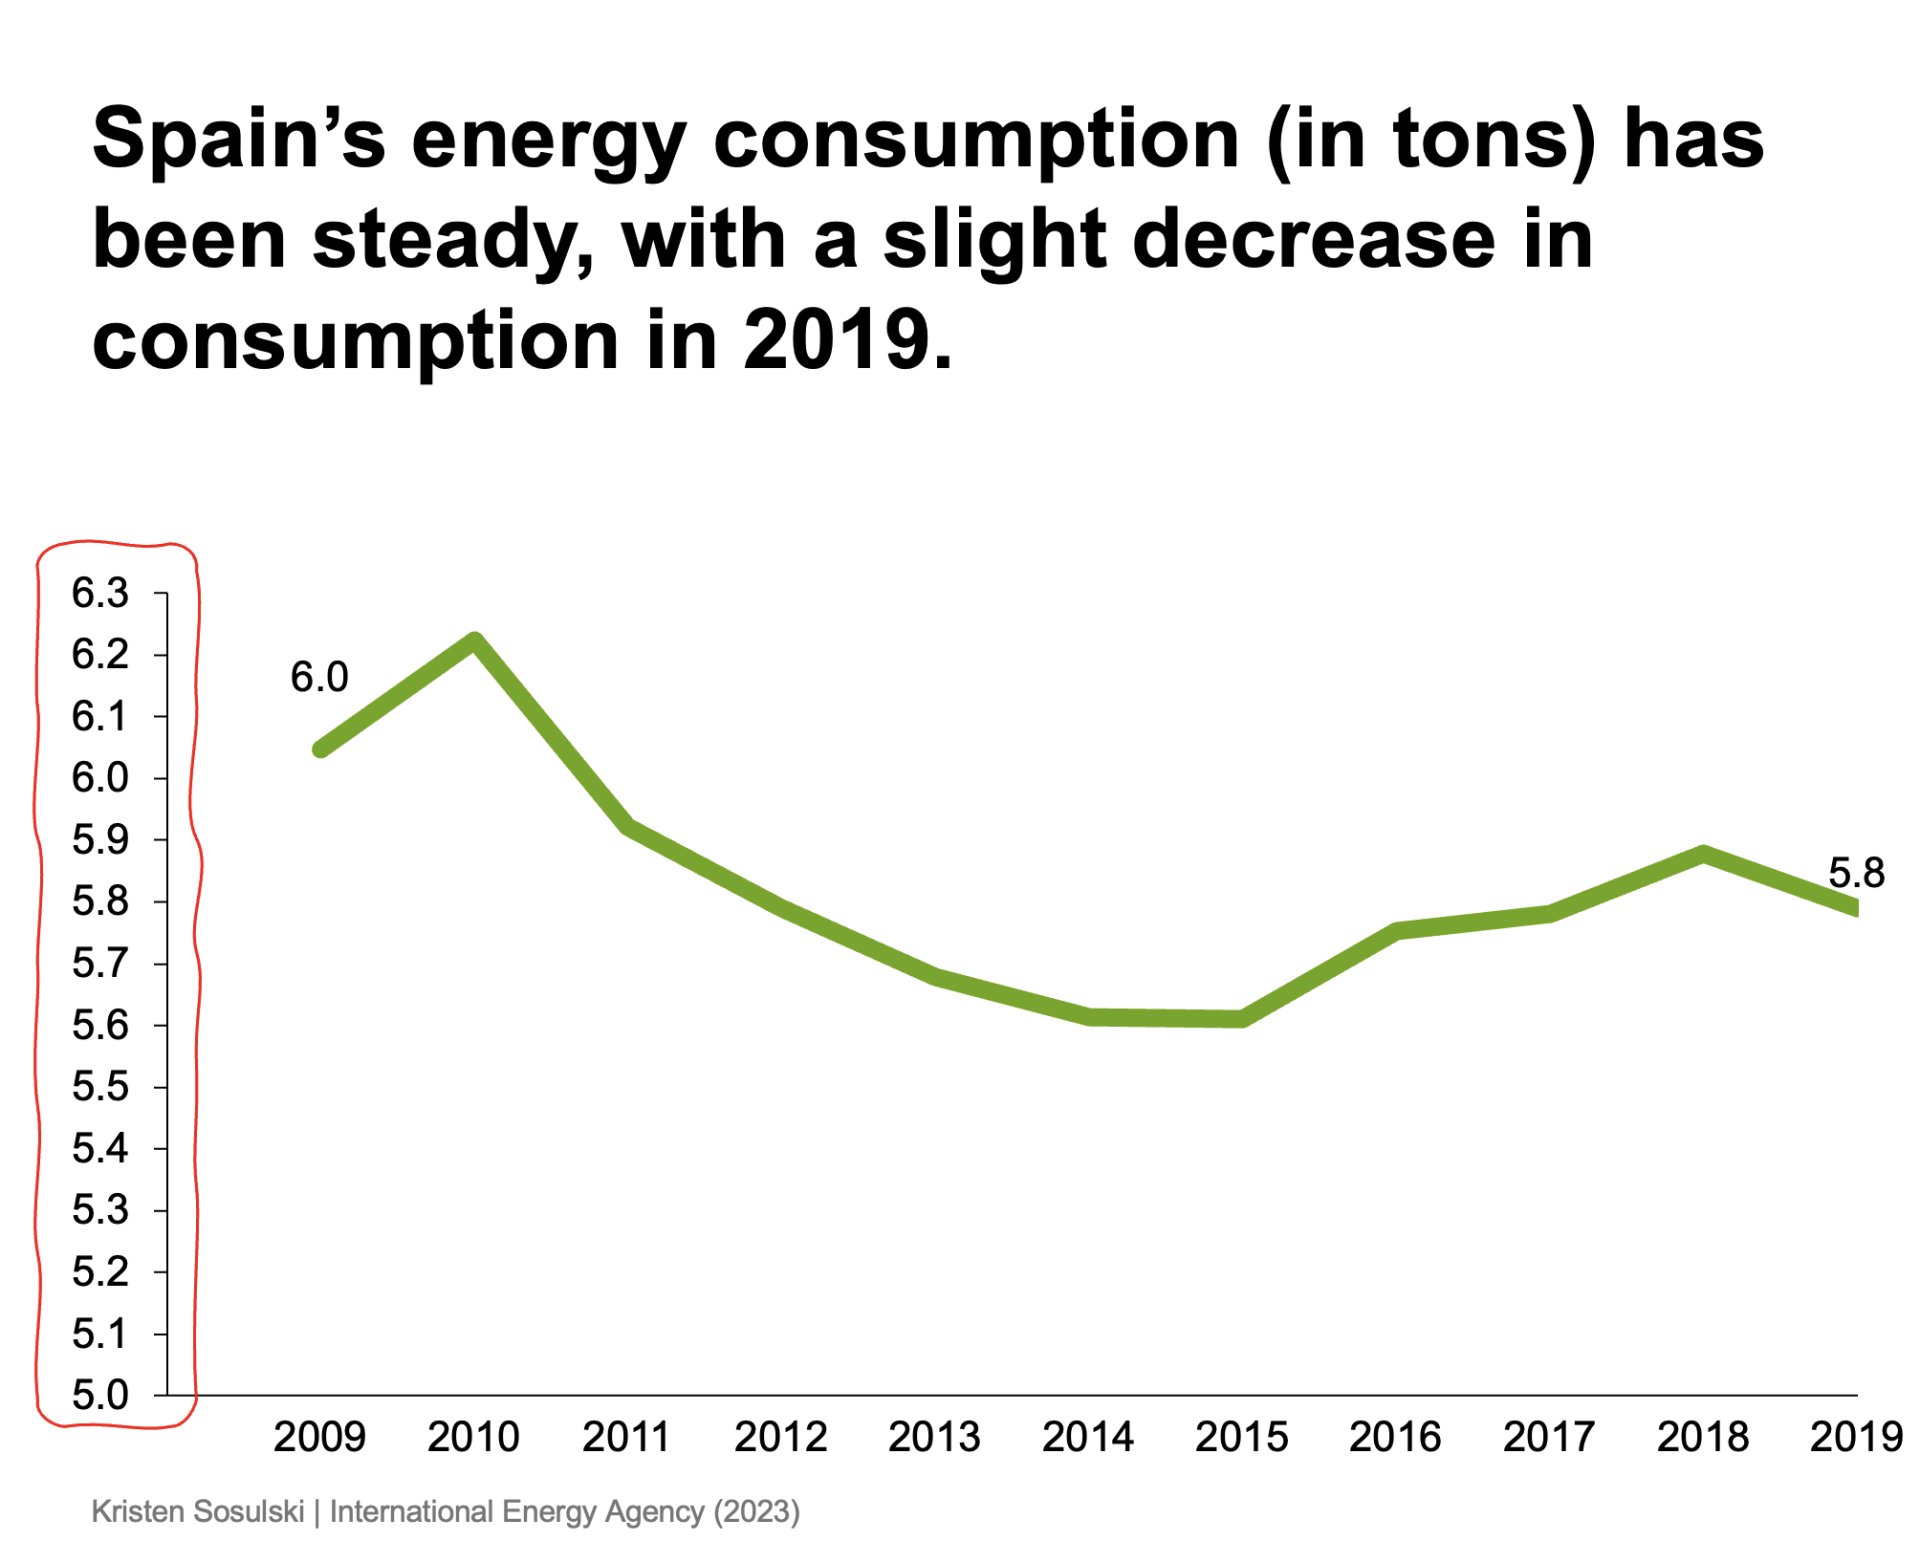
For line charts, variation is best shown when the y-axis is set to a non-zero value. For example, Figure 5.1 shows a time series of energy consumption in Spain. The minimum y-axis value is set to zero. However, the lowest value in the data set is around 5.6 tons, whereas the highest is 6.2 tons. A zero baseline makes it difficult to see variation between these values.
Figure 5.1: A line chart with a zero baseline that visually shows little variation between the values of 5.6 and 6.2
Figure 5.2: A line chart that shows the x-axis years presented horizontally for easy readability
Module 1
-
About Design Principles
-
1Chart Format
-
2Color
-
3Text, Labels, and Legends
-
4Readability
-
Test Your Knowledge
-
5Scales
-
6Data Integrity
-
7Chart Junk
-
8Data Density
-
9Data Richness
-
10Attribution
-
Test Your Knowledge
-
Exercise 1: Build a Vertical Bar
-
Exercise 2: Build a Line Chart
-
Exercise 3: Build a Waterfall Chart

