The meaning of data storytelling in the FP&A world
5 min read — by Akash Choudhary
Data storytelling is a game changing and differentiating skill for FP&A. In the era of advanced analytics, dynamic dashboarding, and impactful data visualization, the art and science of FP&A storytelling have evolved significantly.
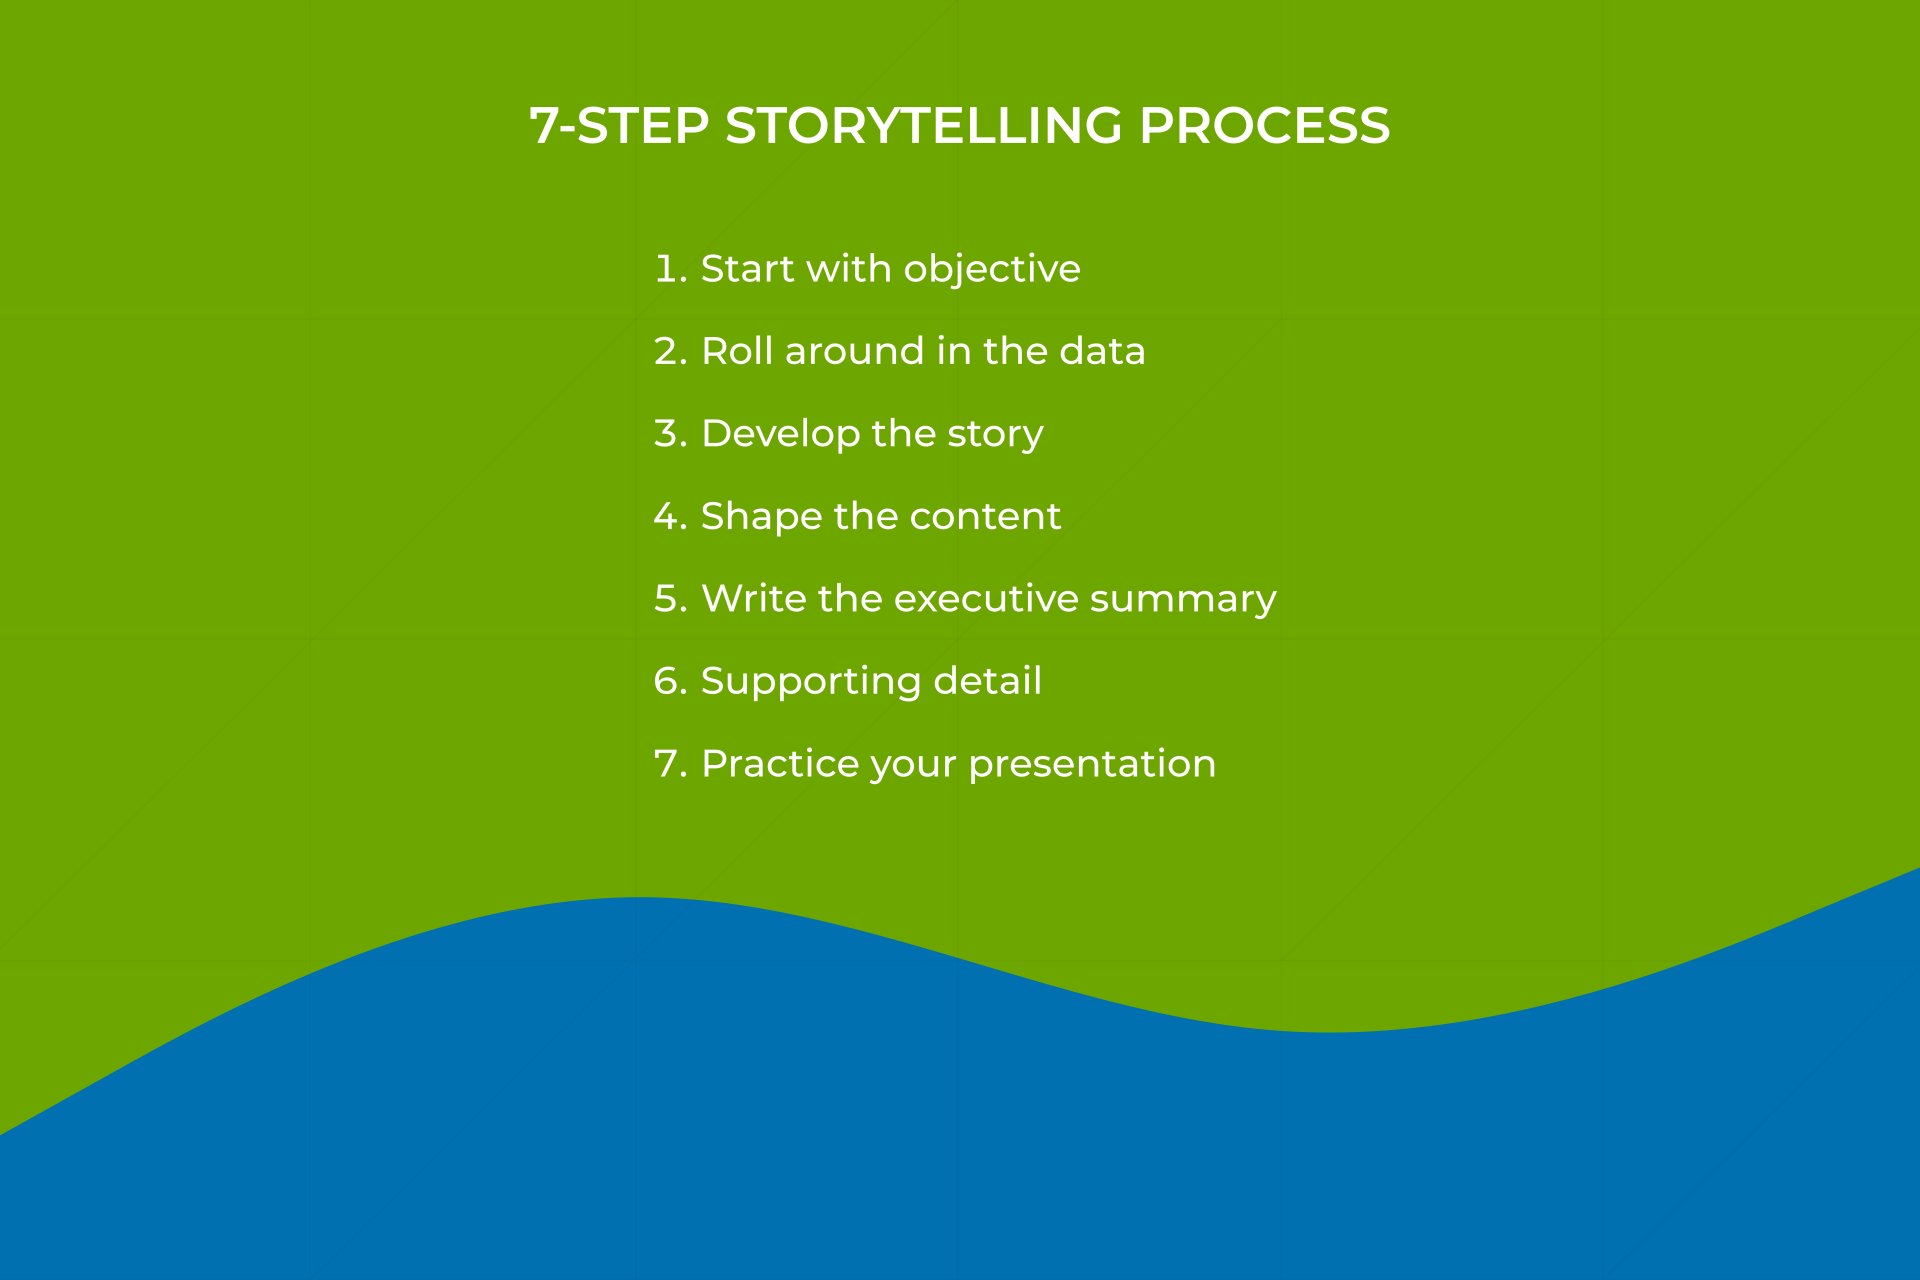
In this blog, we will explore the essential components, and the practical steps involved in creating compelling data-driven business stories. By the end, you will have a comprehensive 7-step process to successfully build and deliver impactful narratives based on data.
‘What’ is effective storytelling?
It is important to clearly define what it means to be a great FP&A storyteller. It is being able to explain business results, trends and forecasts in a structured way that engages the stakeholders. It is having the ability to take complex finance data and turn it into a simple, purposeful, and impactful narrative.
Consider a scenario with a technology startup. The finance professional might begin by illustrating the company's revenue and expenses through a clear and concise chart. They could then weave a narrative around the startup's competitive landscape, shedding light on the factors influencing its performance.
For example, they might say, "Our revenue has experienced steady growth in recent months, driven by successful product launches and strong customer adoption. However, we're facing intensifying competition from industry giants, which necessitates a strategic approach to foster our market position. To sustain our upward trajectory, we must emphasize innovation, agility, and operational efficiency to differentiate ourselves and capture a larger share of the market." This example of effective storytelling demonstrates the ability to translate business data into a compelling narrative that engages stakeholders. By presenting a structured story of revenue growth and market expansion, the professional provides stakeholders with valuable insights and a clear understanding of the company's financial performance and strategic direction.
The ‘why’: The problem to be solved
Why is data storytelling important for FP&A profession? FP&A is often included in ‘back office’ stereotypes which often puts them behind the scenes. Being able to be a great data storyteller helps shatter these outdated stereotypes and puts them at the forefront of the business! Great storytelling engages stakeholders who then want FP&A professionals’ counsel when faced with significant business decisions.
Data is growing at a faster rate than ever before:
The amount of data that businesses have access to is increasing. This represents one of the biggest challenges and opportunities for FP&A professionals. Having the ability to take vast amounts of complex data and pick out what data is most relevant for business leaders is an important skillset. This means that professionals have to discard lots of data which is often a challenge. Having the ability to do this in short time frames and find the most material data to help tell the story is key.
The ‘how’: A 7-step storytelling process
1) Start with the objective
Albert Einstein famously said that if he had an hour to solve a problem, he would spend 55 minutes defining the problem. This approach has some truth when it comes to storytelling. It is critical to clearly define what you are trying to solve and to then use this as a compass for the entire process. This includes documenting the objective and reviewing it with stakeholders. It includes understanding who your audience is and being clear about your approach. It is important to step back and understand the specific context, stakeholders, time frame and other important elements before you start building the story.
2) Roll around in the data
Another critical area after problem definition is spending time with the data and not rushing to build the story and its associated conclusions. This involves developing a structured approach to analyzing data. Starting from top and then zooming in on the areas that need the most analysis and attention. For example, is revenue the major focus area? Or is it profit margin?
Once you have gained a clear understanding of what the data is telling you, it is important to apply analytical techniques. Is a net present value analysis optimal? Or is volume vs rate analysis better? Is a detailed review of product profitability the best fit? Perhaps a combination of techniques is the best approach. This process may feel slow at first, but it is critical to crystallize the story in your mind. Being deliberate with step one and two ultimately speeds up the process.
3) Develop the story using storyboarding
At this stage it is important to write a rough storyline. It should be a structured approach that has a clear throughline and focus. A throughline is a consistent theme that is present in all parts of the story.
The overall approach should start with the key message(s) and high-level story and then dive deeper into all the supporting content. This is analogous to using an outline to write a book or report. What are the chapters of the book? What is the content? How can analyses be incorporated into the story?
4) Build the content and supporting detail (using visualization)
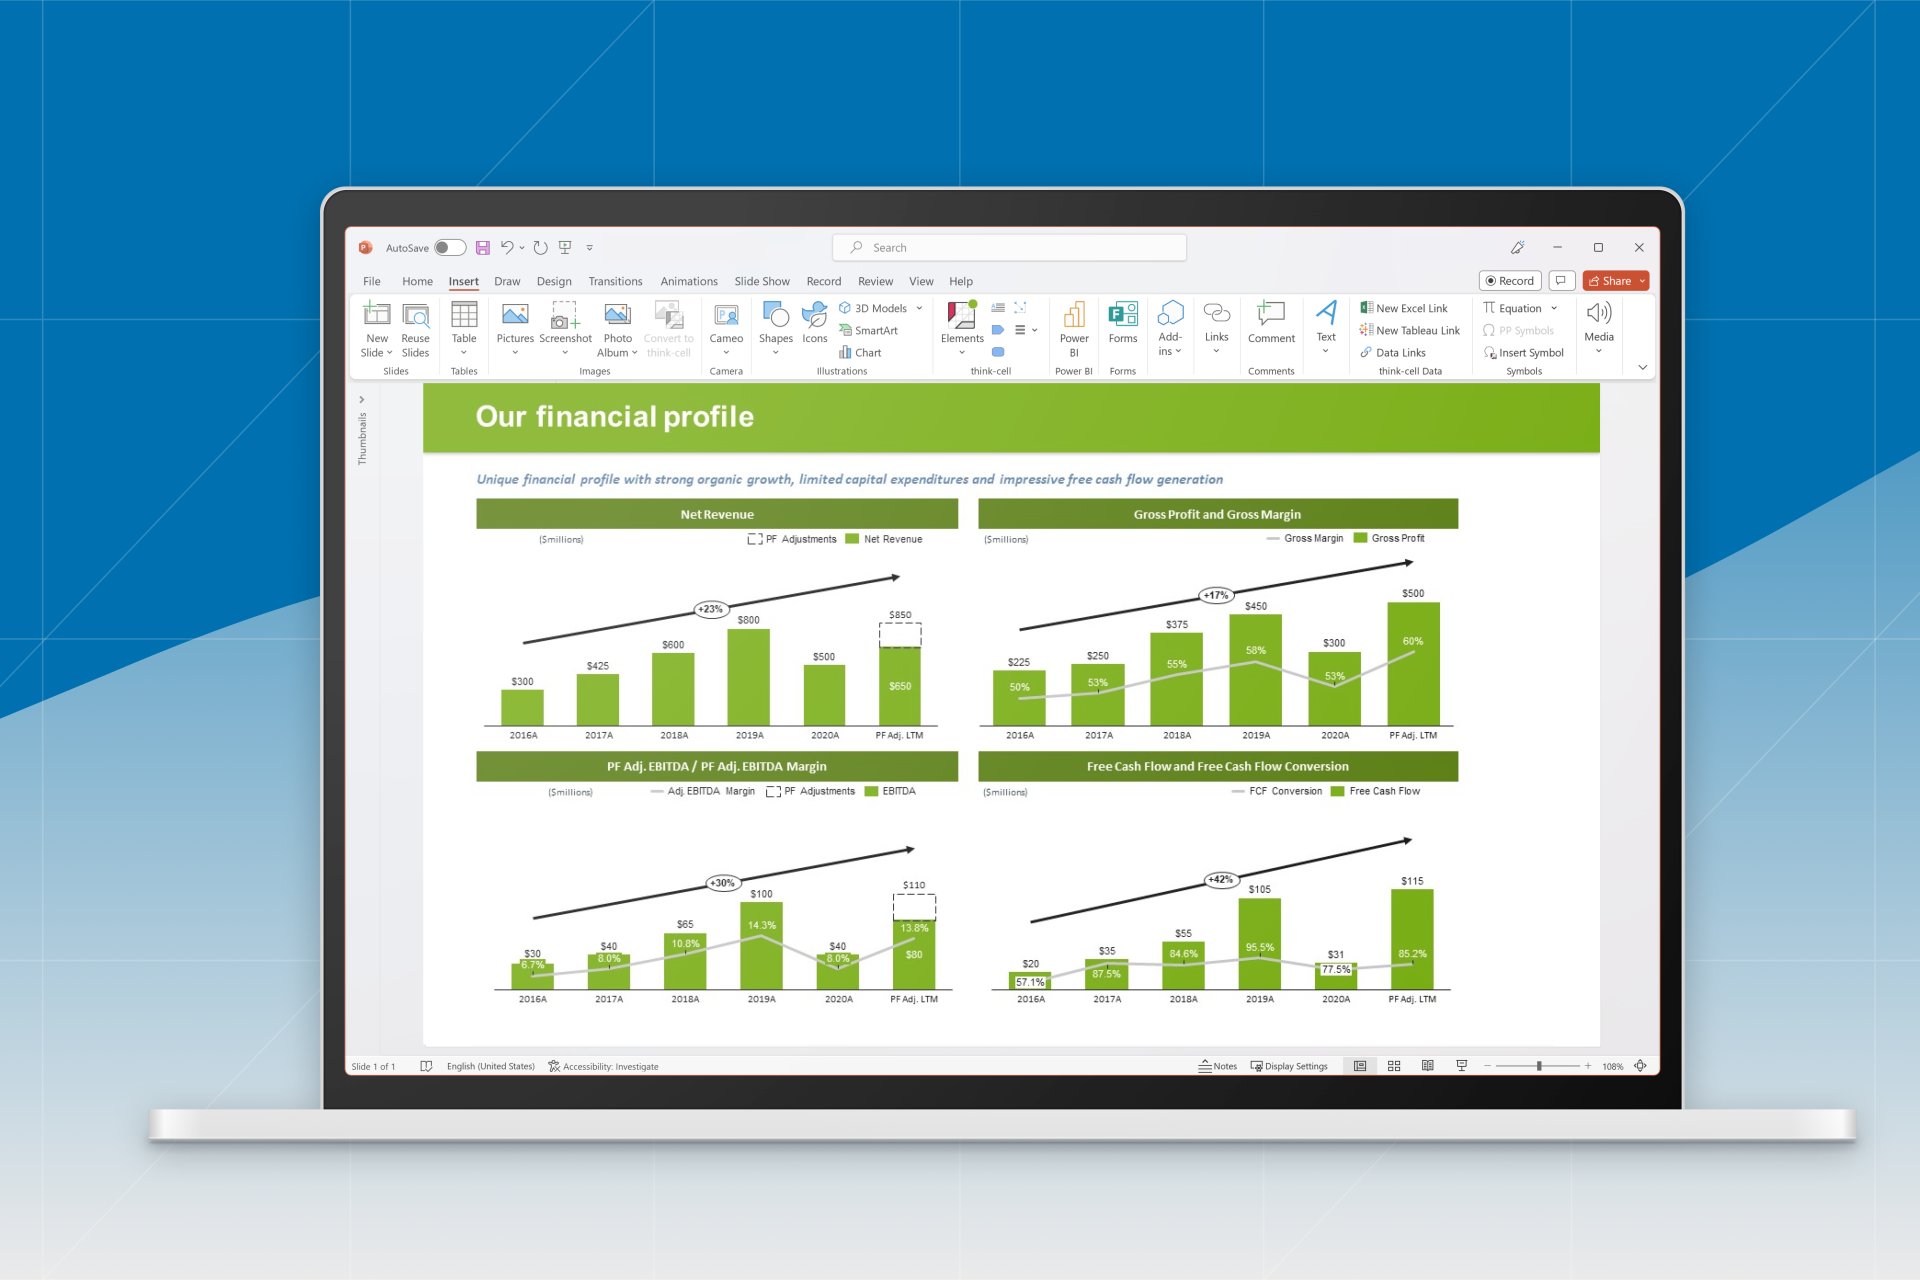
Once the outline is built, it is important to start shaping the content. One critical element of a great story is visualization. Effective data visualization can turn numbers into compelling visuals, making it easier for stakeholders to engage with financial information.
When it comes to presenting data visually, finance professionals should remember a few important tips. First, it's crucial to choose the right type of visualization for the data at hand, such as graphs, tables, diagrams or infographics, depending on the information being conveyed. Second, it's best to keep the visualizations simple and easy to understand, avoiding unnecessary details or complicated visuals. Lastly, using color and design thoughtfully can make the visualizations more appealing and captivating. By following these guidelines, finance professionals can effectively communicate complex financial data to stakeholders in a clear and engaging manner.
think-cell provides a vast number of chart options, including waterfall and Mekko charts to help with visualization of data.
FP&A professionals often deal with recurring data in their presentations, data that needs to be regularly updated and presented in a consistent manner, such as financial reports, budget forecasts, performance metrics, and key performance indicators (KPIs). These professionals rely on accurate and up-to-date data to communicate insights to stakeholders. With think-cell automation, users can link their presentation charts and tables directly to the underlying data sources. This enables automatic updates of the visuals whenever the data changes, saving time and effort in manually updating the presentation and ensures that charts always reflect the most current information, providing accurate and up-to-date visuals for financial analysis and reporting.
5) Write the executive summary and ‘call to action’.
One of the most critical steps of a great data driven story is the executive summary. An approach for this is to use the headlines of each element of the story as a starting point and write executive summaries as condensed versions of the story. They typically fit on a page and tell the story in a structured way. They should end with a ‘call to action’ for the business.
6) Add supporting detail and remove irrelevant data
The process of building the executive summary helps to understand where FP&A professionals need to dig in more. For example, if there is a significant variance on one P&L line or product line, it would be appropriate to perform additional analyses and bring in additional content into the story.
It is also appropriate to put immaterial information into the appendix. Great business stories are to the point and do not have information that is distracting or irrelevant. In the context of storytelling with PowerPoint presentations, each slide should focus on exactly one message and supporting visualizations devoid of distractions for the audience. A ‘less is more’ strategy is a powerful secret of great storytellers.
7) Practice your presentation (content, body language, voice).
Last but not least, practicing verbal delivery of the story and body language is often overlooked. Practicing is a critical process that refines your presentation and ensures it is engaging. Finding an accountability partner to critique your story is a technique that great storytellers use.
Read more:

How to develop and automate financial planning & analysis dashboards
Clear, accurate FP&A dashboards are vital for consistent financial reporting. Read how FP&A professionals can design and automate dashboards to support business objectives.
— by Akash ChoudharySeptember 12, 2023 | 12 min read
Planning for uncertainty with FP&A scenario management
FP&A scenario management is an essential mindset that modern organizations should adopt to plan and make quick, informed decisions in an uncertain environment. This blog offers guidance on how to move to a more agile and adaptable scenario management.
— by Akash ChoudharyAugust 29, 2023 | 5 min read


