Automation with JSON data
- Home
- Resources
- User manual
- think-cell Charts: Data visualization
- Advanced report automation
- Automation with JSON data
Automatically create think-cell presentations with JavaScript Object Notation (JSON). With the think-cell JSON automation, you can do the following:
- Fill PowerPoint templates with data (for example, slide titles and charts)
- Reuse and reorder templates to create new presentations
- Use JSON data and PowerPoint templates from local or remote sources
- Turn real-time data into new presentations with a web service
JSON file structure
This section explains how to structure the JSON file. Snippets from an example file, sample.ppttc, accompany this explanation. See the complete example at the end of this section (Complete JSON example).
In the think-cell installation folder, the ppttc folder contains the following files:
- The JSON schema
ppttc-schema.json - The PowerPoint template
template.pptx - The JSON data file
sample.ppttc
The file ppttc-schema.json describes the rules a .ppttc file must follow to create a PowerPoint presentation with think-cell.
The file template.pptx contains named elements (see Advanced report automation). A template can have any number of slides.
The file sample.ppttc specifies:
- The templates that think-cell will use to create a new presentation
- The order in which the templates will appear
- The JSON data that fills the templates
Specify templates, elements, and their data
The example sample.ppttc shows an array that represents a PowerPoint presentation (see Complete JSON example).
Templates
The array contains a series of objects, each of which represent a copy of a PowerPoint template. In the new presentation, templates appear in the order that you specify in the array. If a template has multiple slides, you can only modify the slide order by editing the template in PowerPoint.
In the array, each template object must have two properties: template and data.
template
The template property is a string that specifies the PowerPoint template that you want to use. The string can be one of the following:
- If you've stored the template locally, specify the template's relative or absolute path in the local file system. The directory separator must be a backslash (\) on Windows—escaped to a double backslash (\\) in JSON—or a slash (/) on macOS.
- If you've stored the template remotely, specify the URL where the template is stored (see Provide templates remotely).
In the simplest case, as shown in Complete JSON example, the template string is just the file name of the PowerPoint template, given that the template is in the same folder as the .ppttc file.
"template": "template.pptx",data
The data property is an array of objects that specify the following:
- Charts and other elements with an AddRangeData name (see Advanced report automation)
- The data that fills these elements
The objects can appear in any order in the data array, regardless of the position of their corresponding elements in the PowerPoint template.
"data": [ ... ]Elements
Each object in the data array has two properties:
namespecifies an element's name, which you assign in AddRangeData Name (see Advanced report automation).tablespecifies the data that fills the element.
If two elements have the same name, think-cell fills them with the same data.
The table value is an array. The structure of the array depends on the element type:
- For an automation text field, Harvey ball, or checkbox, the
tablearray contains a single sub-array with a single object. The object—such as a string of text or a number—fills the text field. - For a chart or table, the
tablearray contains sub-arrays that represent the element's datasheet.
{
	"name": "RightChartTitle",
	"table": [[{"string": "Our orders (10K)"}]]
},
{
	"name": "LeftChart",
	"table": [
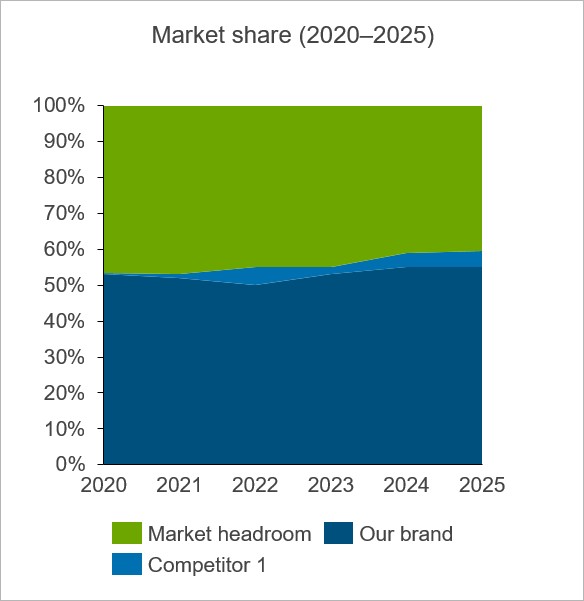
		[null, {"date": "2020-01-01"}, {"date": "2021-01-01"}, {"date": "2022-01-01"}, {"date": "2023-01-01"}, {"date": "2024-01-01"}, {"date": "2025-01-01"}],
		[{"string": "Market headroom"}, {"percentage": 46.5}, {"percentage": 47}, {"percentage": 45}, {"percentage": 45}, {"percentage": 41}, {"percentage": 40.5}],
		[],
		[{"string": "Competitor 1"}, {"percentage": 0.5}, {"percentage": 1}, {"percentage": 5}, {"percentage": 2}, {"percentage": 4}, {"percentage": 4.5}],
		[{"string": "Our brand"}, {"percentage": 53}, {"percentage": 52}, {"percentage": 50}, {"percentage": 53}, {"percentage": 55}, {"percentage": 55}]
	]
},Chart datasheet structure
For a chart, each sub-array in the table array represents a row of a chart's datasheet. For a chart’s specific datasheet layout, refer to its chapter in the user manual or open the chart’s datasheet for reference (see Enter chart data). The following describes the structure of a default chart's rows, as specified in the JSON schema.
First row
The first row is a sub-array containing category labels. An empty first cell (null) precedes the category labels. The data in the first cell does not appear in the chart, so can actually contain any data.
[null, {"date": "2020-01-01"}, {"date": "2021-01-01"}, {"date": "2022-01-01"}, {"date": "2023-01-01"}, {"date": "2024-01-01"}, {"date": "2025-01-01"}],Subsequent rows
Subsequent rows are sub-arrays containing the series labels and the chart's data points. The order of the elements in a sub-array corresponds to the order of the cells in a datasheet row. The first cell in the row contains the series label, which is usually a string. Subsequent cells in the row should contain numbers or, for Gantt charts, dates.
[{"string": "Market headroom"}, {"percentage": 46.5}, {"percentage": 47}, {"percentage": 45}, {"percentage": 45}, {"percentage": 41}, {"percentage": 40.5}],
[],
[{"string": "Competitor 1"}, {"percentage": 0.5}, {"percentage": 1}, {"percentage": 5}, {"percentage": 2}, {"percentage": 4}, {"percentage": 4.5}],
[{"string": "Our brand"}, {"percentage": 53}, {"percentage": 52}, {"percentage": 50}, {"percentage": 53}, {"percentage": 55}, {"percentage": 55}]Empty rows
To specify an empty row, use an empty array ([]).
In the earlier snippet, the empty array changes how think-cell applies the PowerPoint Theme color scheme to the chart's series (see Chart fill scheme). The color scheme assigns dark green to the series in row 3. By leaving row 3 blank, the series Competitor 1 and Our brand are now in rows 4 and 5, to which the color scheme assigns light blue and dark blue, respectively.


Optional rows and columns
In the chart datasheets of your PowerPoint template, you can add or remove optional rows and columns (see Edit datasheet layout). Doing so affects how think-cell interprets the JSON data in the corresponding rows and columns.

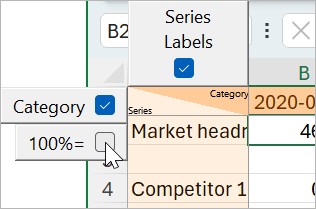
For example, if you add the 100%= row in a chart datasheet, think-cell interprets the second row of JSON data as the totals from which percentages are calculated. If you omit the 100%= row, as in this example, think-cell interprets the JSON data in the second row as ordinary data points.
The following table summarizes common optional rows and columns, their datasheet positions, and their default setting. To check the data layout of a specific chart, double-click the chart to open its datasheet.
|
Option |
Contents |
Datasheet position |
Default setting |
|---|---|---|---|
|
Series |
Series labels |
Column 1 |
Selected |
|
Category |
Category labels |
Row 1 |
Selected |
|
100%= |
Totals for percentage calculations |
Row 2 (if Category selected) Row 1 (if Category not selected) |
Not selected |
Automation text fields, Harvey balls, and checkboxes
When filling automation text fields, single Harvey balls, and single checkboxes with JSON data, think-cell expects a table array with one cell. Within the table array, the cell is represented as a single sub-array containing a single object.
{
	"name": "SlideTitle",
	"table": [[{"string": "Competition: Germany"}]]
},If a Harvey ball or checkbox is part of a table, simply specify the element's content in its corresponding table cell.
Cell data types
In a .ppttc file, cells can contain the following data types.
|
Data type |
Key |
Example |
Notes |
|---|---|---|---|
|
Text |
|
|
All printable Unicode (UTF-8) characters are supported. |
|
Number |
|
|
Decimal separator must be a point (.). |
|
Calendar date |
|
|
Required format: |
|
Percentage |
|
|
Decimal separator must be a point (.). Do not include percent sign (%). |
|
Datasheet cell fill color |
|
Hex: RGB: |
Add To apply datasheet fill colors to chart features, in the PowerPoint template, select Use Datasheet Fill (see Chart fill scheme). |
|
Empty cell |
Not applicable |
|
Do not enclose |
Complete JSON example
See the complete JSON example from sample.ppttc below:
[
	{
		"template": "template.pptx",
		"data": [
			{
				"name": "SlideTitle",
				"table": [[{"string": "Competition: Germany"}]]
			},
			{
				"name": "LeftChartTitle",
				"table": [[{"string": "Market share (2020–2025)"}]]
			},
			{
				"name": "RightChartTitle",
				"table": [[{"string": "Our orders (10K)"}]]
			},
			{
				"name": "LeftChart",
				"table": [
					[null, {"date": "2020-01-01"}, {"date": "2021-01-01"}, {"date": "2022-01-01"}, {"date": "2023-01-01"}, {"date": "2024-01-01"}, {"date": "2025-01-01"}],
					[{"string": "Market headroom"}, {"percentage": 46.5}, {"percentage": 47}, {"percentage": 45}, {"percentage": 45}, {"percentage": 41}, {"percentage": 40.5}],
					[],
					[{"string": "Competitor 1"}, {"percentage": 0.5}, {"percentage": 1}, {"percentage": 5}, {"percentage": 2}, {"percentage": 4}, {"percentage": 4.5}],
					[{"string": "Our brand"}, {"percentage": 53}, {"percentage": 52}, {"percentage": 50}, {"percentage": 53}, {"percentage": 55}, {"percentage": 55}]
				]
			},
			{
				"name": "RightChart",
				"table": [
					[null, {"date": "2020-01-01"}, {"date": "2021-01-01"}, {"date": "2022-01-01"}, {"date": "2023-01-01"}, {"date": "2024-01-01"}, {"date": "2025-01-01"}],
					[{"string": "Pending"}, {"number": 0, "fill": "#ff0000"}, {"number": 0, "fill": "#ff0000"}, {"number": 0, "fill": "#ff0000"}, {"number": 0, "fill": "#ff0000"}, {"number": 0, "fill": "#ff0000"}, {"number": 14, "fill": "#ff0000"}],
					[null, {"number": 709}, {"number": 712}, {"number": 710}, {"number": 700}, {"number": 760}, {"number": 747}]
				]
			}
		]
	},
	{
		"template": "template.pptx",
		"data": [
			{
				"name": "SlideTitle",
				"table": [[{"string": "Competition: Canada"}]]
			},
			{
				"name": "LeftChartTitle",
				"table": [[{"string": "Market share (2022–2025)"}]]
			},
			{
				"name": "RightChartTitle",
				"table": [[{"string": "Our orders (1K)"}]]
			},
			{
				"name": "LeftChart",
				"table": [
					[null, {"date": "2022-01-01"}, {"date": "2023-01-01"}, {"date": "2024-01-01"}, {"date": "2025-01-01"}],
					[{"string": "Market headroom"}, {"percentage": 34}, {"percentage": 38}, {"percentage": 41}, {"percentage": 42}],
					[{"string": "Competitor 2"}, {"percentage": 31}, {"percentage": 17}, {"percentage": 15}, {"percentage": 14}],
					[{"string": "Competitor 1"}, {"percentage": 20}, {"percentage": 10}, {"percentage": 9}, {"percentage": 7}],
					[{"string": "Our brand"}, {"percentage": 15}, {"percentage": 35}, {"percentage": 35}, {"percentage": 37}]
				]
			},
			{
				"name": "RightChart",
				"table": [
					[null, {"date": "2022-01-01"}, {"date": "2023-01-01"}, {"date": "2024-01-01"}, {"date": "2025-01-01"}],
					[{"string": "Pending"}, {"number": 0, "fill": "#ff0000"}, {"number": 0, "fill": "#ff0000"}, {"number": 0, "fill": "#ff0000"}, {"number": 15, "fill": "#ff0000"}],
					[null, {"number": 250}, {"number": 401}, {"number": 481}, {"number": 476}]
				]
			}
		]
	}
]Create presentations with JSON data
When think-cell is installed, it tells your operating system to open .ppttc files with think-cell. To open JSON files with think-cell in File Explorer (Windows) or Finder (macOS)—for example, by double-clicking—use the .ppttc extension.
When a JSON file is opened, think-cell does the following:
- think-cell reads the file and checks it for errors.
- think-cell creates a new presentation. The presentation consists of copies of the slide templates specified in the top-level array in the JSON file.
- In the template copies, think-cell fills the elements (identified by
name) with their corresponding data (specified intable). The elements update accordingly. - The new presentation opens in PowerPoint. You can save or further edit the presentation.
Create presentations from the command line

Create a presentation from JSON data from the command line by entering the following:
PPTTC_PATH PPTTC_INPUT -o PPTX_OUTPUT
Replace the following:
PPTTC_PATH: the path ofppttc.exePPTTC_INPUT: the path of your .ppttc filePPTX_OUTPUT: the name of the .pptx file that you create, preceded by the path where you want to save it
The executable file ppttc.exe is located in ppttc in the think-cell installation folder. Call ppttc.exe in automation scripts to create new PowerPoint presentations.
Provide JSON data remotely
Remotely generate JSON data for a .ppttc file on a server. To create a new presentation, the user downloads the .ppttc file from a web browser and opens it with think-cell.
For an example of how to generate and download JSON data with a server, in the think-cell installation folder, see /ppttc/sample.html. The file sample.html contains the following elements:
- HTML markup for a button that, when clicked, compiles JSON data on the fly
- Some static JSON data. In a typical use case, the JSON data comes from other sources.
- A JavaScript function that downloads the .ppttc file to the user's computer
After the user downloads the .ppttc file, they can save or open it. When the user opens the file, think-cell creates a new presentation using the JSON data (see Create presentations with JSON data).
Provide templates remotely
To provide PowerPoint templates via a server, do the following:
- In the JSON file, provide a URL instead of a local path for the
templatekey. The URL protocol can be HTTP or HTTPS. - Ensure that the user opening the .ppttc file has access to the remote template.
A standard think-cell installation on the user's machine is enough to generate think-cell presentations with remote JSON data and templates.
Create presentations remotely
Set up automated workflows in which users download think-cell presentations with custom data. To download presentations, users just need a web browser. They don't need to have think-cell installed on their computer.
Setting up these workflows requires the think-cell server, which only operates on Windows. The think-cell server takes JSON data as input and delivers PowerPoint presentations as output.
Run the think-cell server

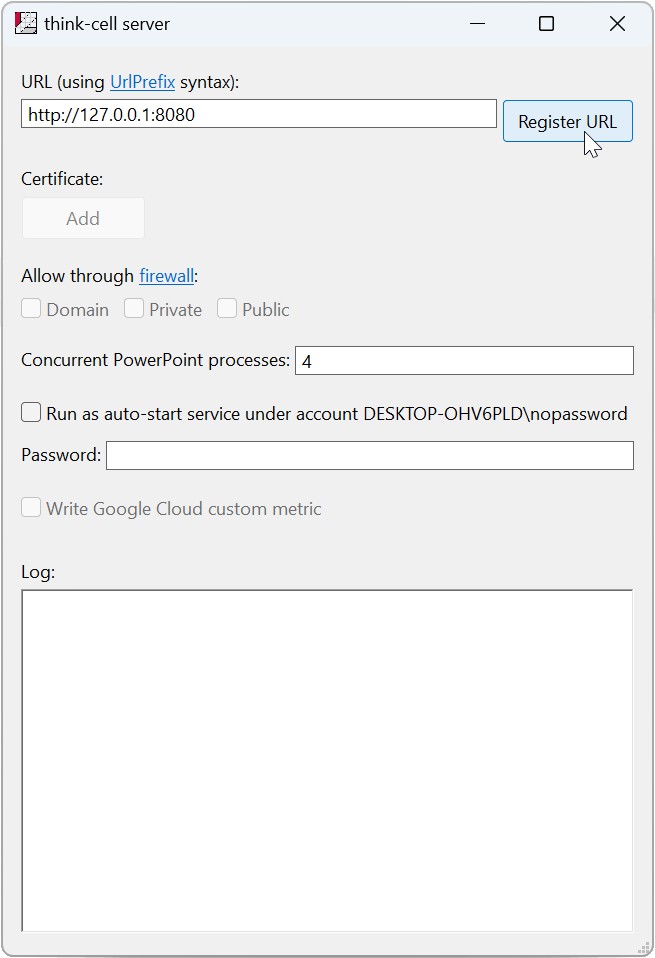
To start the think-cell server, follow these steps:
- In the think-cell installation folder, run
tcserver.exe. - Enter a URL that specifies the IP address and port that the server should listen on. The server protocol is HTTP or HTTPS.
- Select Register URL.
- When prompted, allow the think-cell server to make changes to your device.

To stop the think-cell server, follow these steps:
- Select Unregister URL.
- When prompted, allow the think-cell server to make changes to your device.
The Log field displays the following:
- Confirmation that the server has started or stopped listening on a URL
- All client requests and server responses
The server accepts JSON data as HTTP POST requests with media type (a.k.a. MIME type) application/vnd.think-cell.ppttc+json and responds with a PowerPoint file.
Run as auto-start service
To automatically start the think-cell server when you turn on your computer, follow these steps:
- In the think-cell server dialog, select the Run as auto-start service option.
- In Password, enter the password for the account named in the Run as auto-start service option.
Try it out!

Create a PowerPoint presentation with the click of a button using our ready-made example.
- Start the think-cell server with the URL
http://127.0.0.1:8080. - Open
http://127.0.0.1:8080in a browser. - The webpage "ppttc test" will open. Select Send .ppttc to server and get .pptx.
The think-cell server creates a PowerPoint presentation from JSON data. The browser downloads the presentation to your computer.
The HTML source code of the "ppttc test" page demonstrates a possible use of think-cell JSON automation. The source code can serve as a starting point for your own automated workflow. The code contains the following elements:
- HTML markup for a button that, when clicked, invokes a method using
XMLHttpRequestto communicate with the think-cell server. - Some static JSON data. In a typical use case, the JSON data comes from other sources.
- A JavaScript function to send the JSON data to the think-cell server. The server generates the HTTP POST request with the static JSON data. The server response is a file download.
The "ppttc test" page uses JavaScript to send HTTP POST requests and to save the think-cell server's response as a PowerPoint file. Obviously, other languages work, too.ample