Creating a slide with maximum efficiency: The one-tab PowerPoint challenge
- Home
- Resources
- Content hub
- Creating a slide with maximum efficiency: The one-tab PowerPoint challenge
26 min read — Stephen Bench-Capon
PowerPoint is full of useful features, but navigating the various tabs, menus and sidebars to actually find the function you need can be a huge drain on your productivity. Some things seem hidden away, and even if you do know where something is, it might require several clicks before you get to it.
Minimizing mouse clicks has always been a key aim of our charting software, and now, with the release of the think-cell Suite, our users can also work with the think-cell PowerPoint tab. The think-cell tab brings together all the most important tools needed for creating business presentations and makes them accessible from a single location.
To show you how to work with the think-cell tab and to demonstrate the impact it can have on your efficiency, we’ve set ourselves a challenge: can we build a professional PowerPoint slide with just the tools available on a single tab?
The think-cell tab is available as part of the think-cell Suite, which you can try for yourself by downloading a free 30-day trial:
The anatomy of a PowerPoint tab
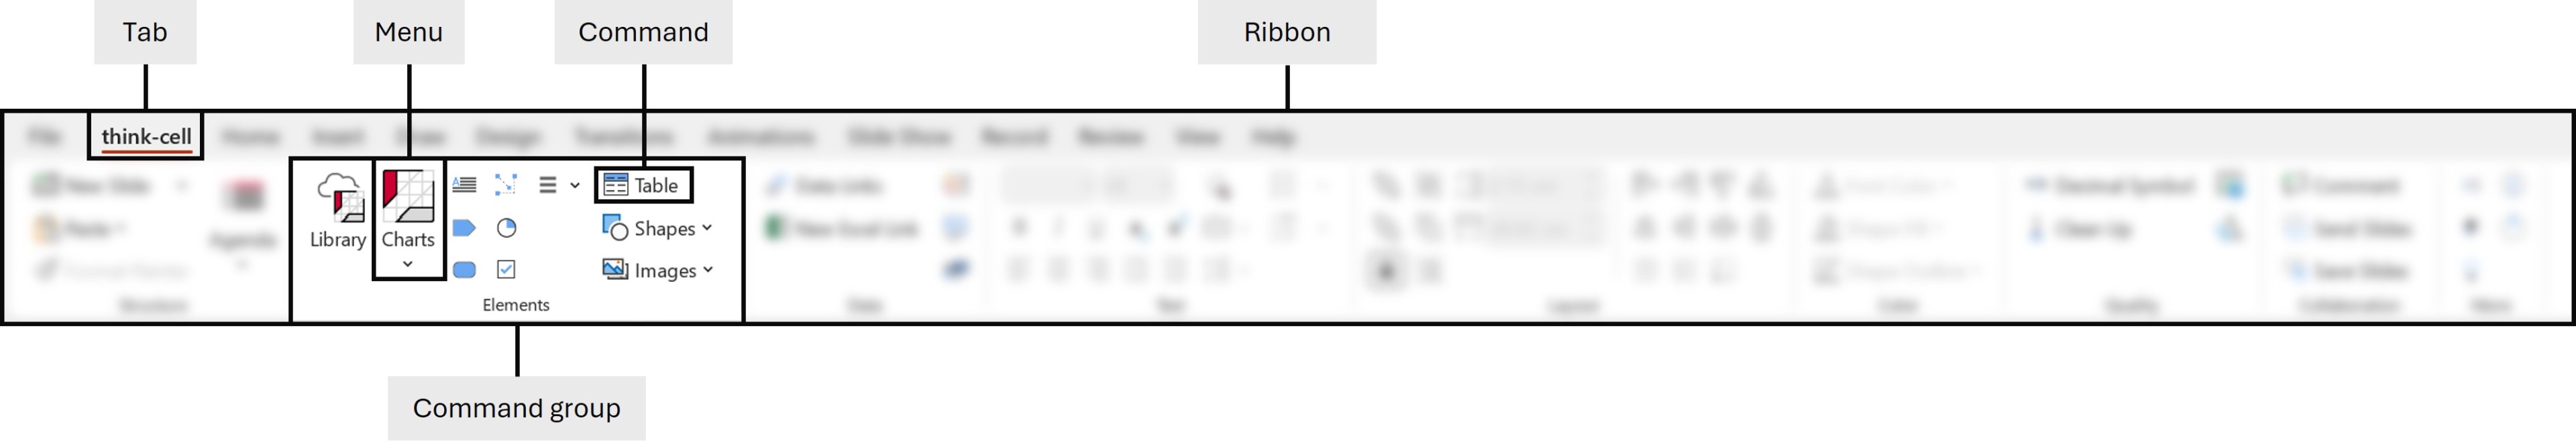
PowerPoint tabs are part of a hierarchical framework that is designed to create a smooth, intuitive user experience by grouping related commands together. The following are the most important definitions within this framework:
- Ribbon: The set of toolbars at the top of the window in PowerPoint.
- Tabs: The individual toolbars within the ribbon, such as Home, Insert or Help.
- Command groups: The sections of each tab where related tools are found, such as Slides, Font or Paragraph. Also referred to as groups.
- Menus: A set of tools that can be expanded to access the individual commands, indicated by a down arrow next to the icon and/or name.
- Commands: The individual tools within a command group, represented by an icon and/or the name of the command.
Setup: Giving yourself the best chance of success
If you’re trying to maximize efficiency by keeping tab-switching to a minimum, then you can’t afford to give up valuable screen real estate to functions like Dictate and Convert to SmartArt. For the best possible experience, you’ll want something purpose-built for efficiency. You’ll want the think-cell tab.

Customize your toolkit to suit your style
In this article, we’ll be using the default think-cell tab layout to keep things simple. But of course, as you get used to working with any piece of software, you’ll develop your own preferred workflows and discover your own favorite way of organizing things.
That’s why the think-cell tab is fully customizable. You can position it where you like within the PowerPoint ribbon and you can choose which command groups, menus, and tools are included, as well as their precise arrangement along the tab.
Access the resources you need
Once you’ve got your think-cell tab installed, it pays to do some groundwork before launching into slide production. For a business presentation, you’ll want access to your corporate templates. You don’t want to get bogged down constructing layouts from scratch when you’re supposed to be focusing on your content.
The best way to prepare is to add relevant presentations and any other useful assets to your think-cell Library. You can do this at any time but we’d recommend setting things up before you start so you don’t have to break your creative flow once you’re nicely in the presentation building zone.
If you haven’t tried out the think-cell Library yet, you can download a free 30-day trial with full access to the full range of features. Never start from a blank slide again:
Execution: Building a slide of increasing complexity
When building our slide, we’ll start by adding the foundational content and go through three levels of increasing complexity to explore a range of business presentation workflows:
- Level 1: Creating a slide, adding a chart and populating the content
- Level 2: Supporting the story with data for more sophisticated messaging, while ensuring accuracy
- Level 3: Adding annotations, polishing formatting and getting the slide presentation-ready
All of these tasks should be possible from the think-cell tab. Clearly, if you were adding ink annotations, you’d need the tools on the Draw tab. Or you could customize your think-cell tab by adding the requisite commands. But that’s a specialized task. The default think-cell tab is designed to prioritize what matters most and avoid distractions from anything less-than-critical for business presentations.
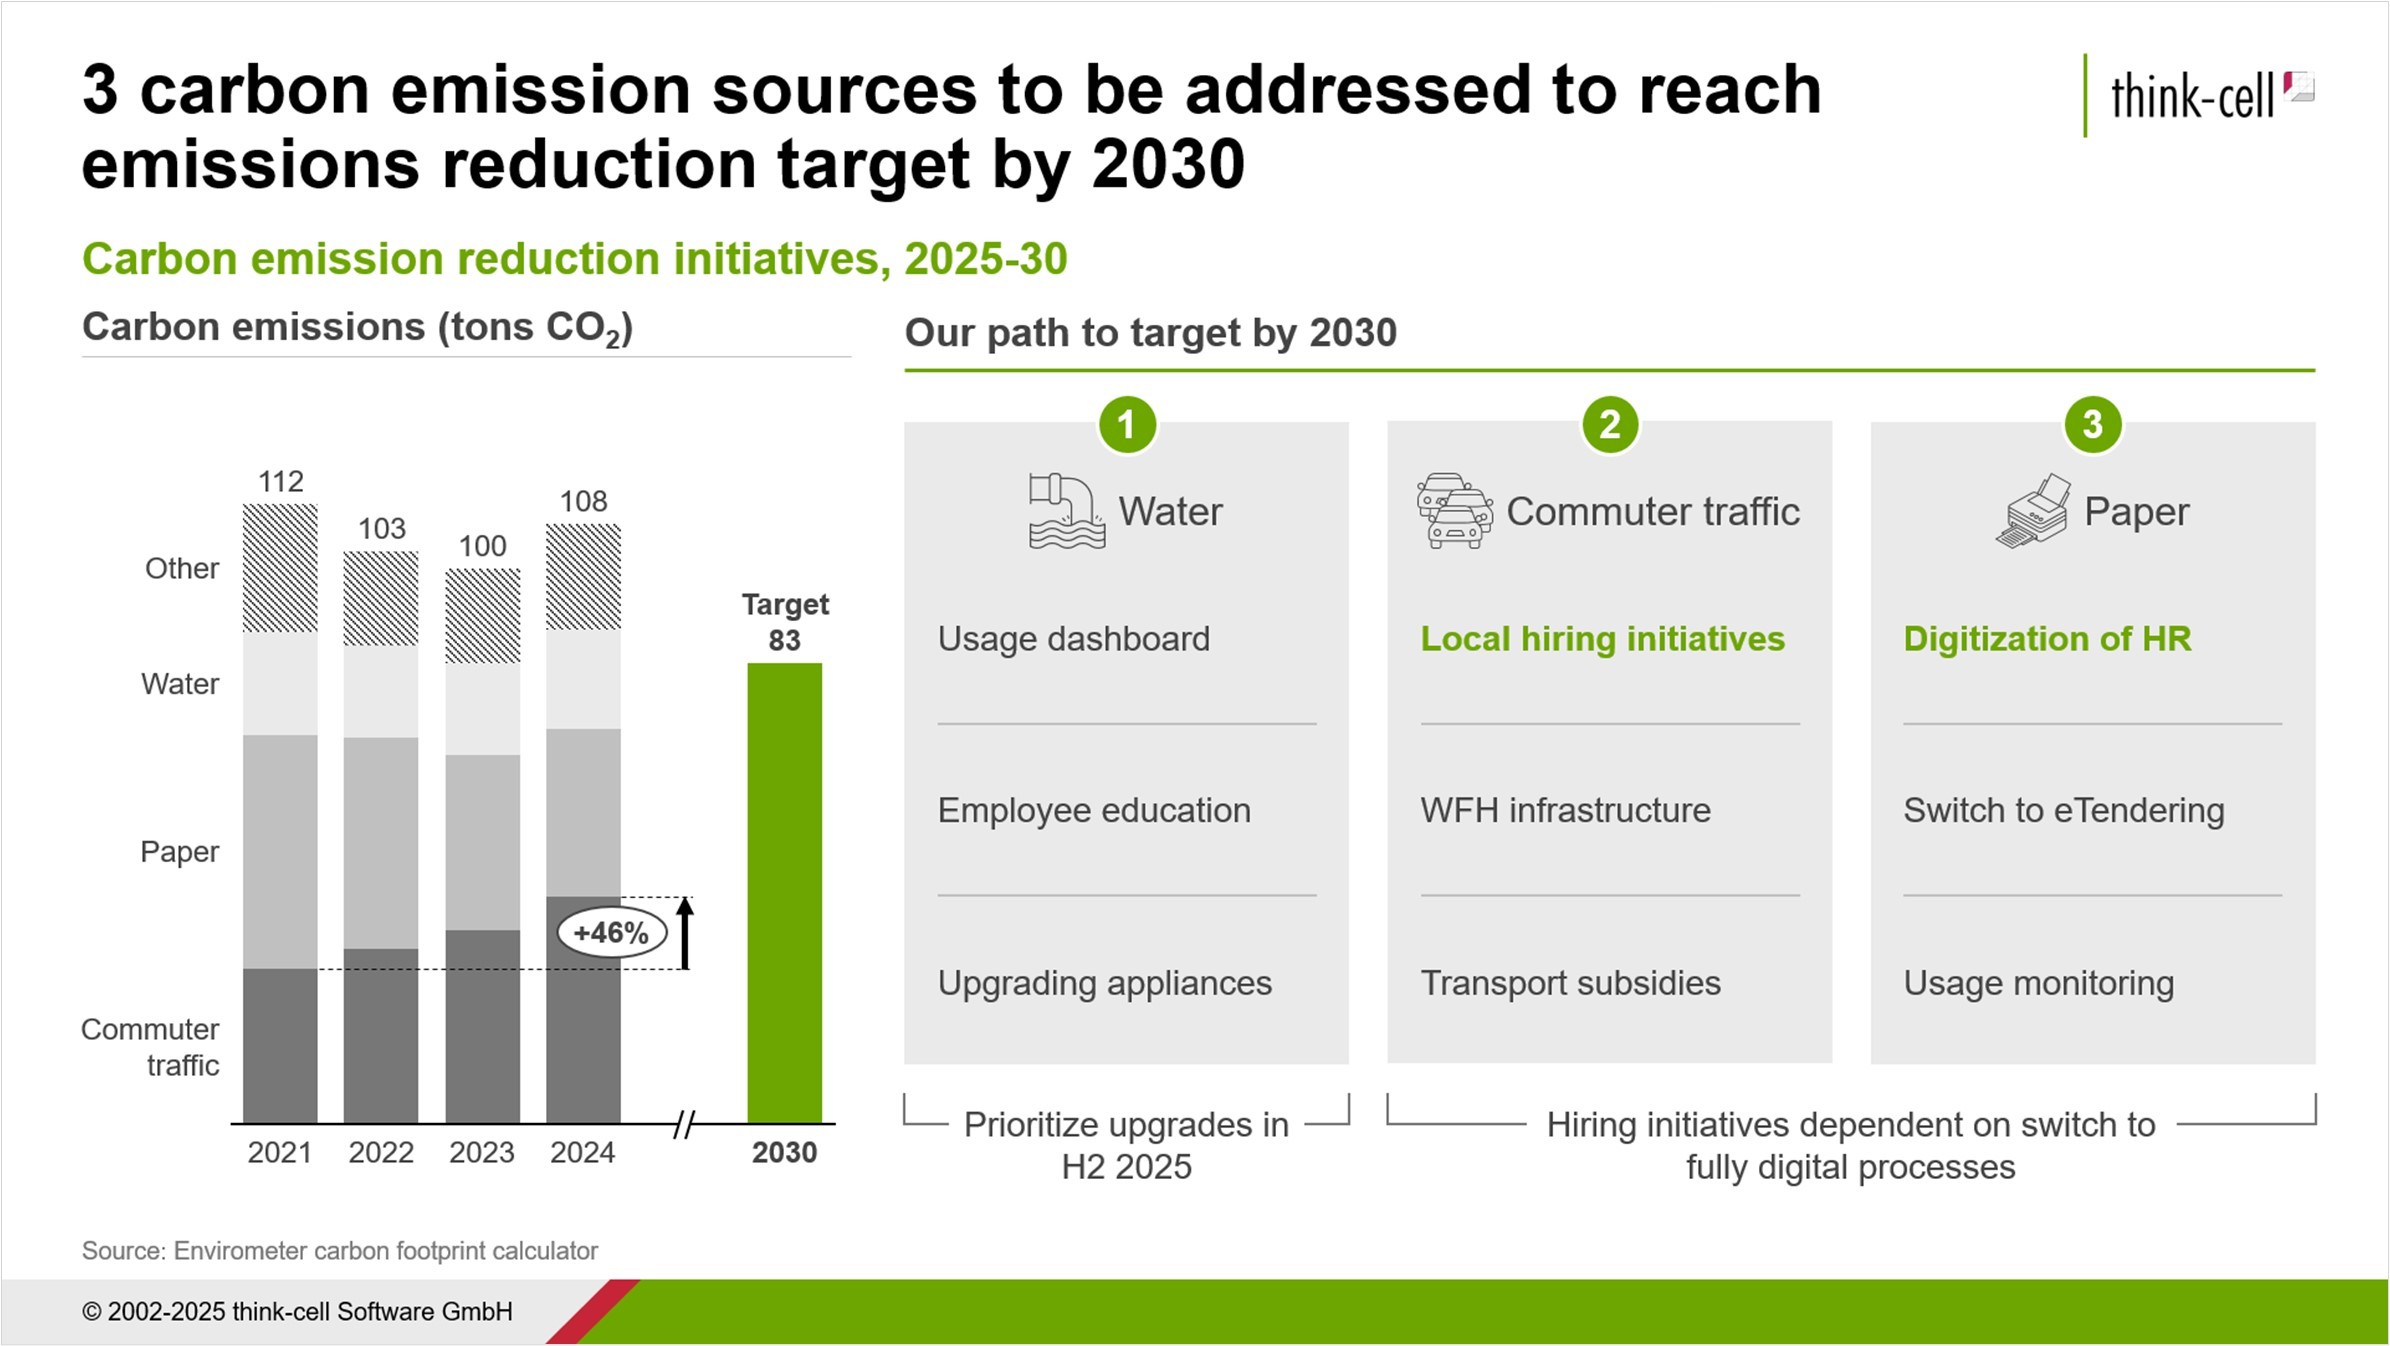
Level 1: Creating a slide, adding a chart and populating the content
Let’s avoid staring at a blank slide and start with a template from the think-cell Library. You can find inspiration and get started straight away, knowing that you’re working with something that has been carefully composed and is fully brand-compliant.
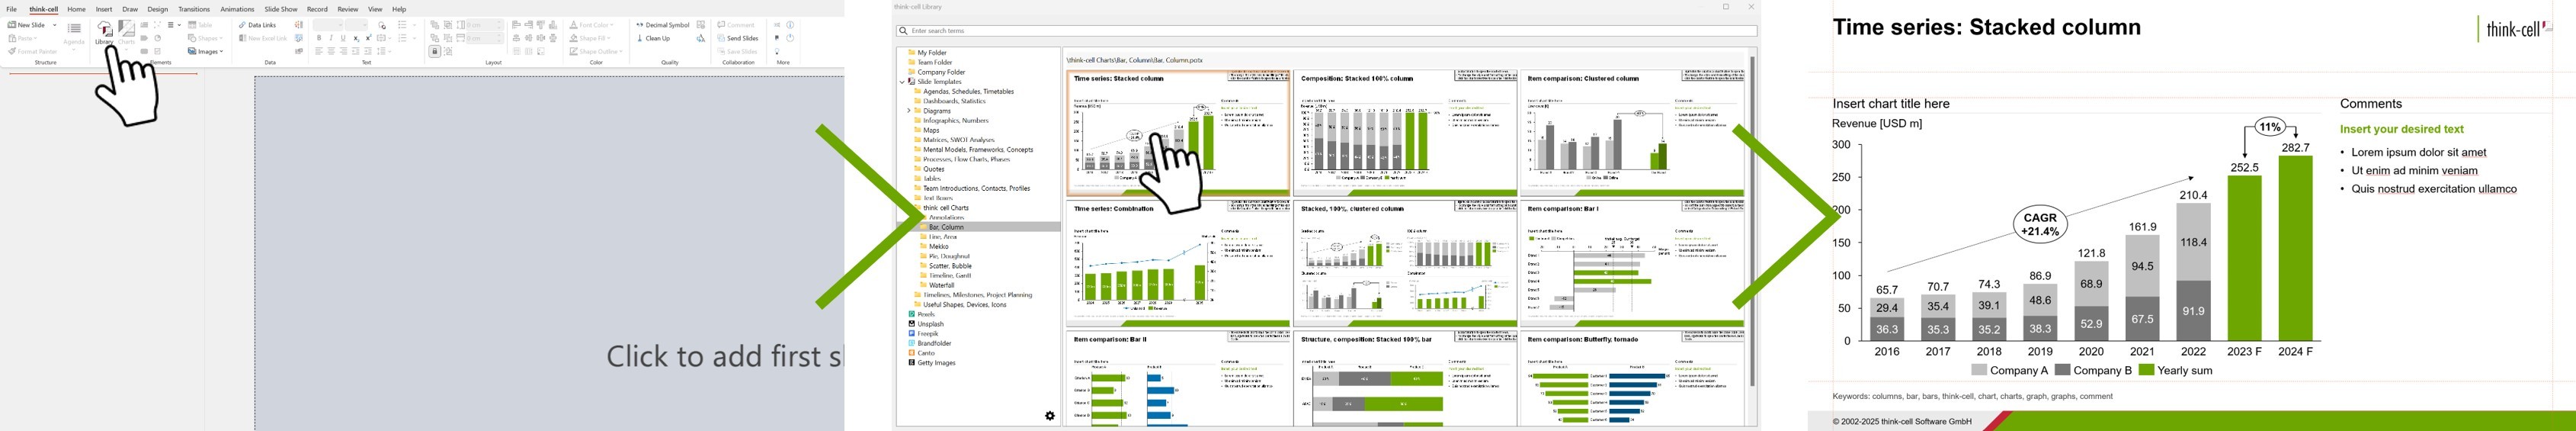
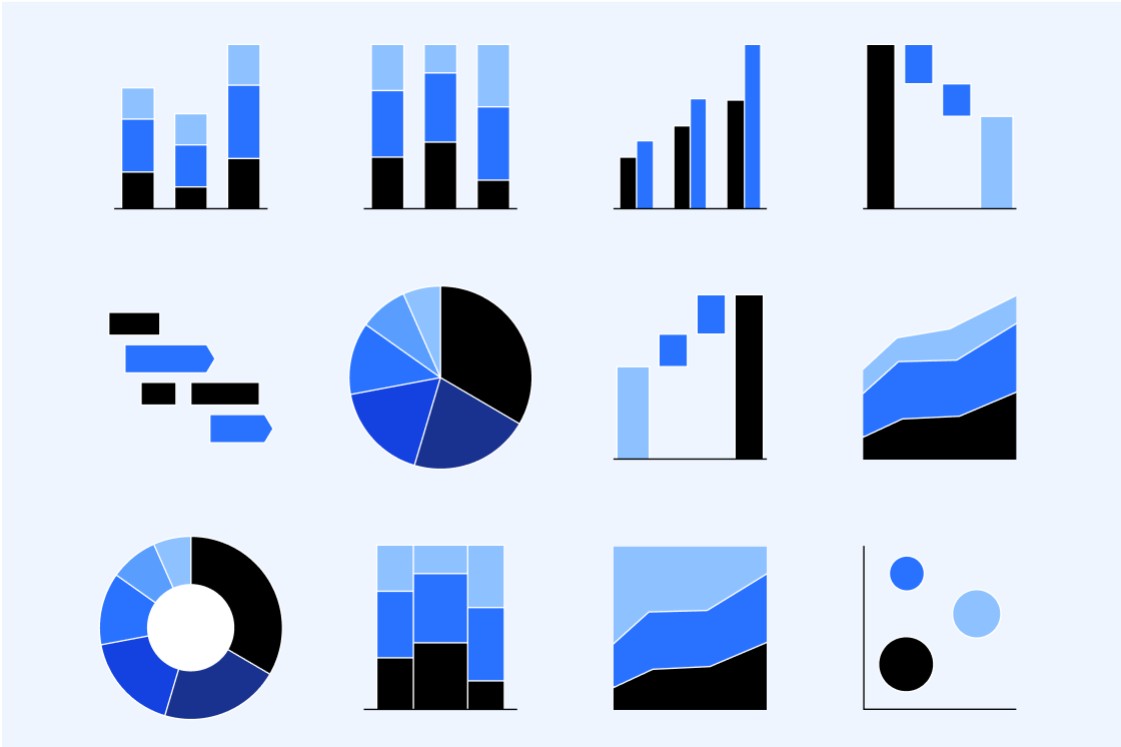
With the slide in, the next step is to replace the chart. The think-cell Library templates are a good source inspiration but you’re unlikely to find something that matches the precise structure of your dataset, so inserting a new chart is usually the best option. You’ll find Charts right next to Library in the think-cell tab.

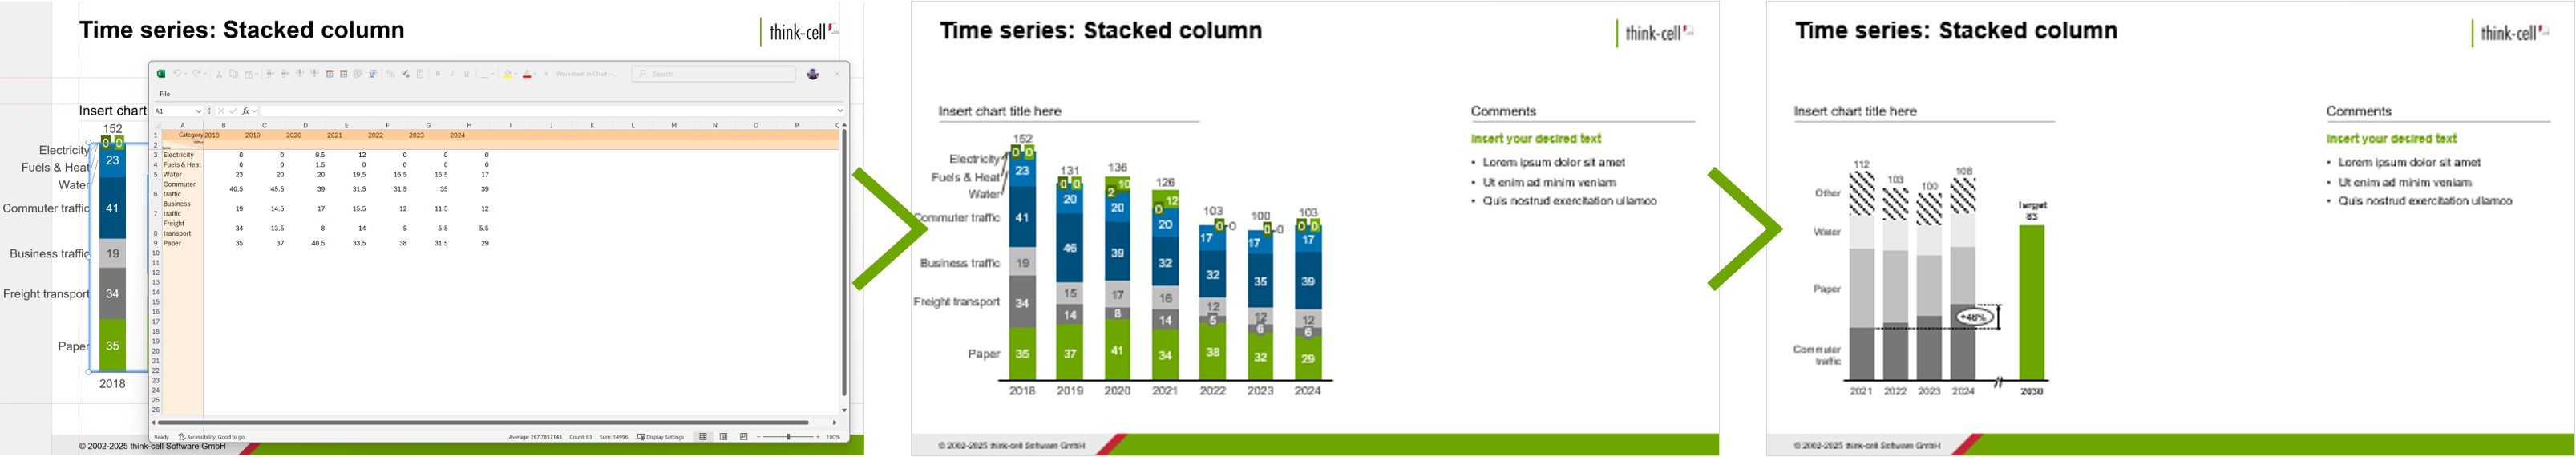
The datasheet opens automatically when we insert the chart. Once we’ve added our data, we can do some first adjustments and make the chart more focused by moving some of the less important series into ‘Other’. Because it’s a think-cell chart, we can do all our formatting without even leaving the chart area, let alone needing to switch tabs.
Visit our features page to find out more about the formatting and annotation options available with think-cell Charts.
The next step is adding some content to the slide. Our chosen template has space to provide context for three series from the column chart. We can find suitable icons in the think-cell Library and then we’ll use text boxes to show the initiatives associated with each.
Besides text boxes, you’ve also got tables, shapes and checkboxes, and in the Text command group of the tab you’ve got your bullet-points and other formatting options. Having everything in the same tab makes it quick to try out different ideas and see what works best, without having to search through menus for something you might not end up using.
There’s still a bit of work to do on your first draft. But editing the action title, writing a subtitle, and inserting a footnote are more about crafting the content than struggling with PowerPoint. And to finish it off, the tab’s Text and Color groups provide everything you need to experiment with colors and shape outlines, or make tweaks to font sizes.
Level 2: Supporting the story with data for more sophisticated messaging
With most of your slide elements added, you have your overall structure in place and know the story you want to tell. Now it’s time to move to the next level by adding some more powerful messaging.
Supporting your arguments with precise data is a great way of making a slide more convincing, but only if your data is accurate. If your headline says 42% and your chart shows 51%, you instantly lose credibility. You can avoid this—and keep your reputation intact—by setting up a link to your Excel sheet so all data comes from the same source. If the chart updates, so will all your other on-slide values.
It’s easy to establish this kind of Excel link from the Data command group, which is the next one along from the Elements group on the think-cell tab.

When you link to Excel, you’ll need to select the relevant data point. In our example, we’ll add a simple formula to give us the target value we want to highlight. Linking to useful values from your Excel sheet lets you enrich annotations and headings to make your storytelling more tangible.
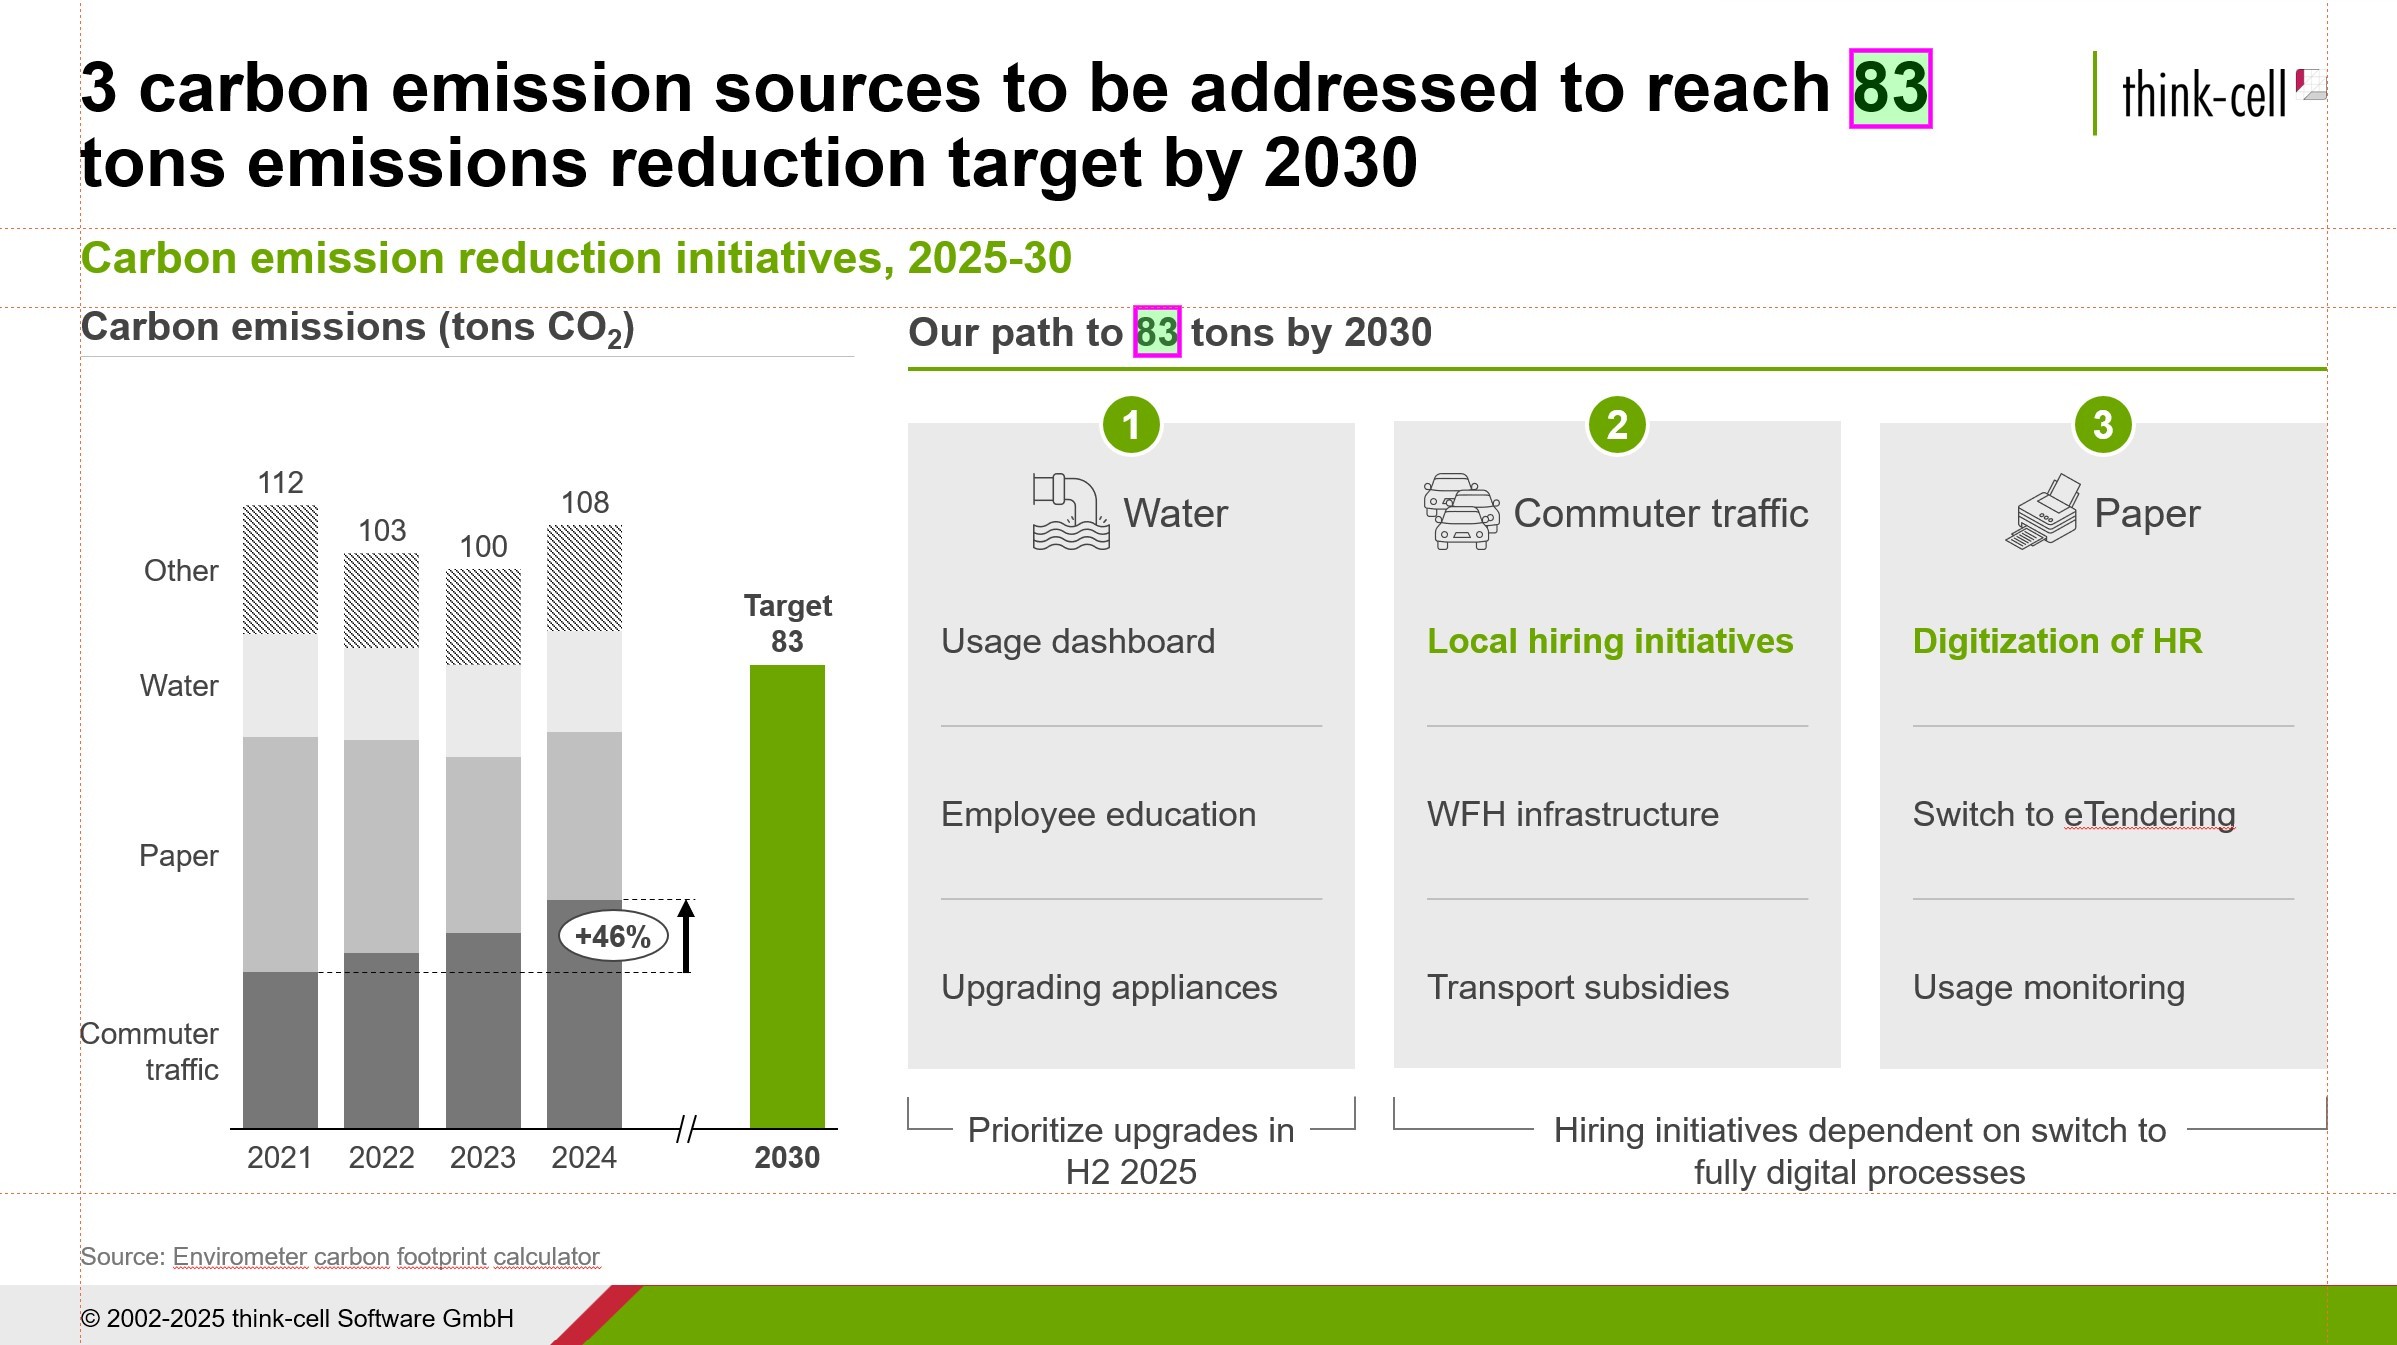
The advantage of having your data linked is you can build your slide with provisional values and easily update it once the numbers are finalized. This lets you get ahead of the curve so you can use the time before the deadline for adding insights, rather than double-checking and fixing errors.
Level 3: Adding annotations, polishing formatting and getting the slide presentation-ready
Once you’ve constructed your slide and set up your data links, you should have something that’s complete and accurate, but it’s still essentially a draft. There are a few more steps to take before your slide is ready to present. In particular:
- Create balance between the on-slide elements by aligning objects and giving them room to breathe.
- Highlight what’s important by using color or other means of drawing the audience’s attention to key messages.
- Polish your slide by checking consistency across aspects like formatting, fonts, spelling and decimal points.
All of these tasks can be completed directly from the think-cell tab, with the Layout, Color and Quality command groups providing everything you need.

This stage of editing, when your slide is nearly finished, is also where you have a chance to add any flourishes. As your deadline approaches, you’ll often think of another annotation or an elegant way of visually linking elements that will help bring your message home.
You don’t want to make breaking changes at a late stage, but with the think-cell tab, any ideas you have can be quickly and flexibly implemented. You have the library to access icons and images, you have the shapes to add extra callouts, you even have Harvey balls you can use to succinctly provide valuable context.
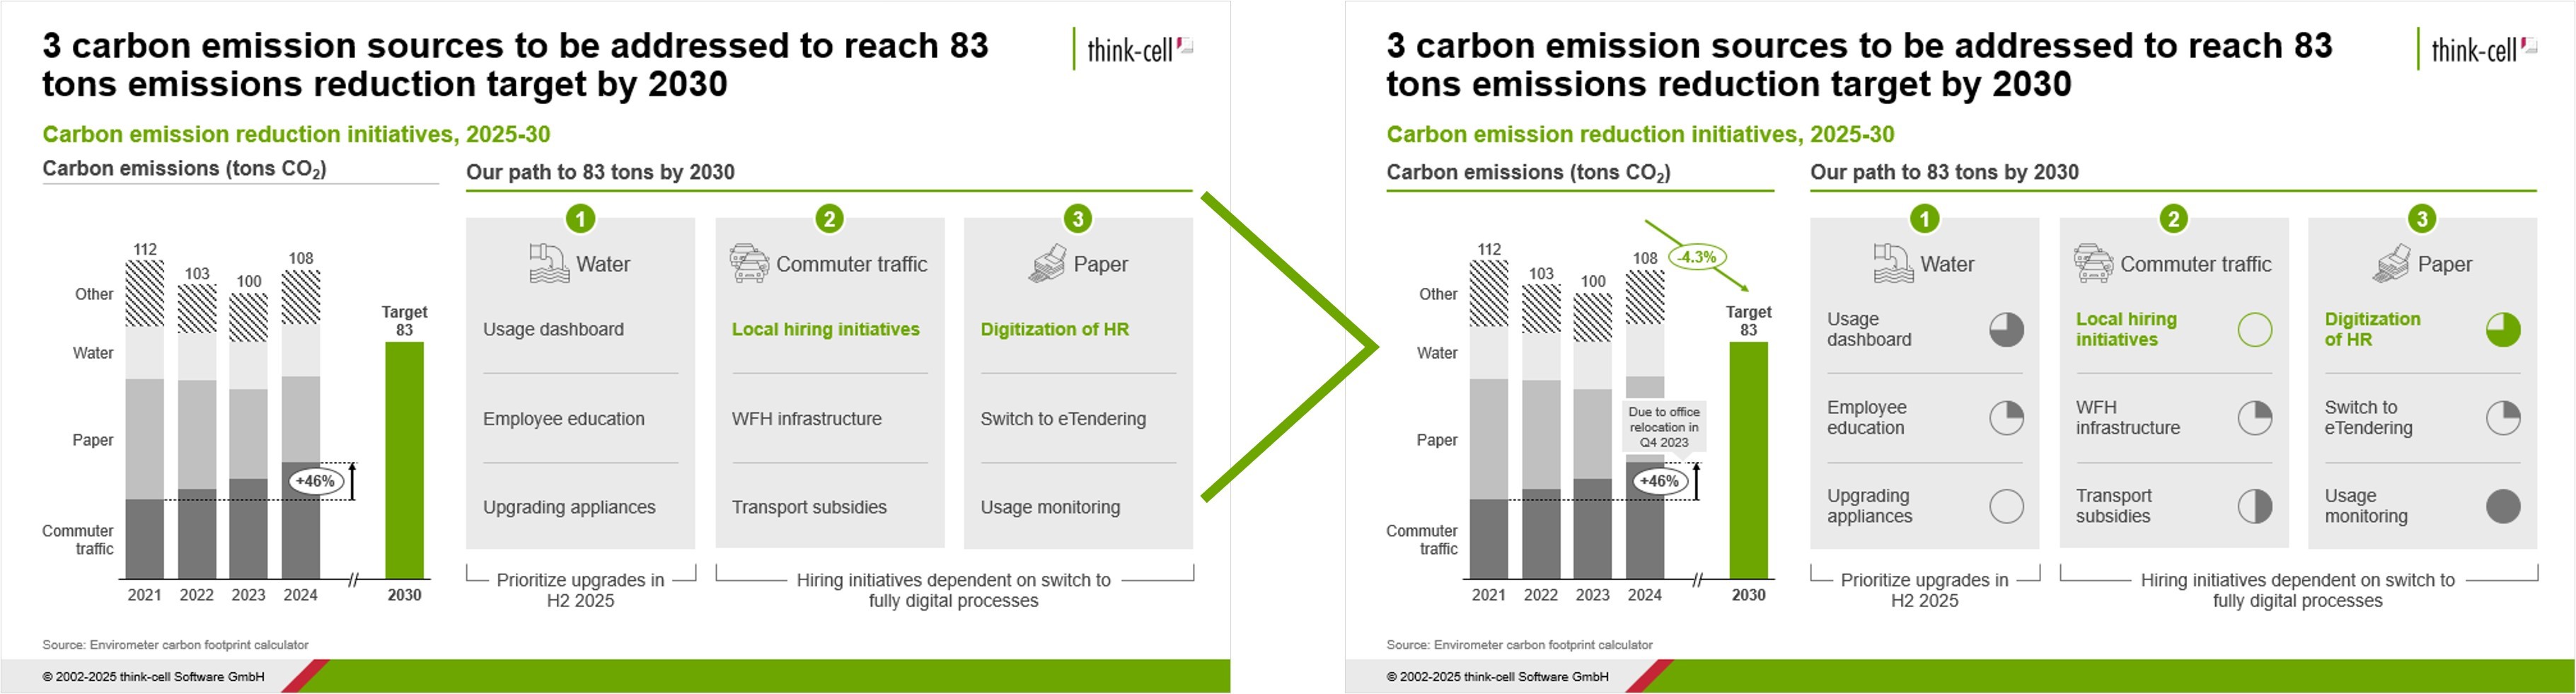
If late edits cause shifts in your layout, you’ve got your alignment tools to make sure everything is still on point and ready for review. To prepare the slide for sharing—as you can probably guess by now—you don’t even have to leave the think-cell tab. You’ve got two think-cell Tools, Clean up and Send slides, right where you need them in the Quality and Collaboration command groups.

Next steps: Building complete presentations and adding customization
While you can always add further enhancements or polish, we’ve now got a slide with a clear main message, a data-driven chart, insightful annotations, and additional context for the audience. All aligned and presented to a professional standard. And all without leaving the think-cell tab.
As this article has only focused on one slide, we haven’t covered the think-cell tab’s full range of commands. If we’d been building an entire presentation, we would have also used the Structure group, which is where you can create an agenda with chapters and a table of contents.

Besides Structure, the only command group we didn’t touch was More, which provides easy access to online resources like our user manual or video tutorials.
That’s the default tab, but don’t forget you can also customize it to fit your way of working. This could be adding a favorite command, removing a command you don’t need, or simply rearranging what’s already included. The think-cell tab lets you make whatever adjustments you like to make your PowerPoint workflows more efficient and free up time and headspace for creativity.
Try out the think-cell tab to see how it can enhance your PowerPoint efficiency in your free 30-day trial:
Explore this topic further with AI:
Read more:
This article runs through 7 tools that will speed up your PowerPoint work and help you build polished slides faster, without compromising on consistency.
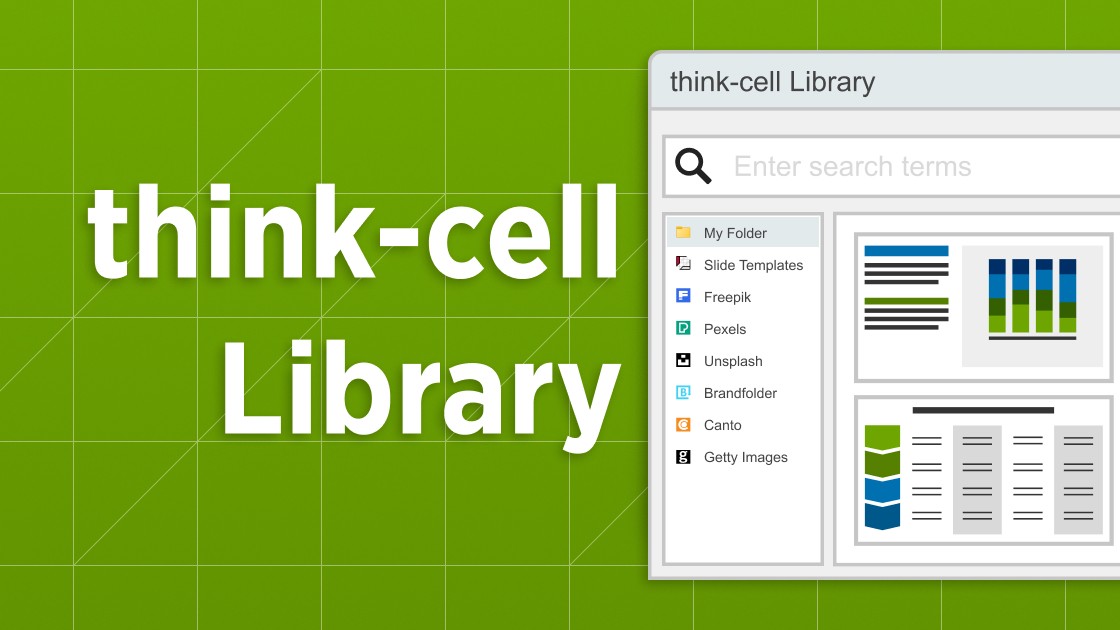
Explore the think-cell Library and see how you can save time, search effectively, and access a wealth of resources to ensure you never have to start your presentation from a blank slide again.

Discover the think-cell Suite and its comprehensive range of PowerPoint and Excel tools that support you along every stage of the presentation journey.
Discover more than 70 PowerPoint slide templates that help you get started faster and cover all the most common business presentation scenarios.