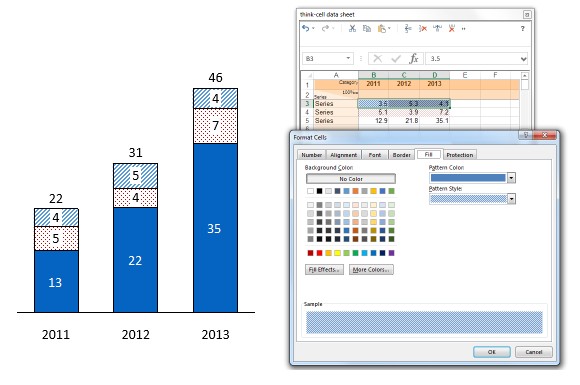
KB0138: How do I set a colored pattern for a segment, area, or bubble?
- Home
- Resources
- Knowledge base
- KB0138
For occasional use
- Left-click on the chart and check Use Datasheet Fill on Top in the color scheme control (see Chart fill scheme).
- Open the chart's datasheet, select some cells, then right-click > Format Cells… > Fill
- Set the desired combination of fill color and pattern in the dialog > OK.

In area charts, the fill color and pattern of the cell containing the series name determines the style for the whole series, across all categories. The fill color and pattern of individual data points' cells has no effect.
In bubble charts, the fill color and pattern can be applied to any cell that belongs to the respective data point.
Adding colored patterns as a standard option to think-cell menus
You have the option of customizing think-cell's menus on a per-file or per-template basis with think-cell style files as described in our user manual in Brand compliance. The pattern fill option is explained in Style files.