How Japan Tobacco Inc. uses think-cell to improve the decision-making process

Minutes saved per complex chart
Trouble with Excel link to PowerPoint
Elimination of manual updates to charts
About Japan Tobacco
Japan Tobacco Inc. (JT) is a leading global tobacco company with products sold in over 130 markets. In addition to the tobacco business, they operate pharmaceutical and processed food businesses. In order to adapt to the ever-changing business environment, the company is working to change its behavior from the perspective of the customer.
The Intelligence Department, which is involved in marketing work at the company, particularly market survey and customer insight analysis, uses think-cell to create reports on a daily basis, in order to disseminate the results of their analysis within the company and contribute to management decision-making. We spoke to the person in charge about the background and issues that led to the use of think-cell, how think-cell is used, and the results obtained.
|
Name |
Japan Tobacco Inc. |
|
Business |
Business activities centered on Tobacco, Pharmaceutical, and processed food |
|
Employee count |
53000+ |
|
Used think-cell features |
Stacked column and bar chart, Pie and doughnut chart, Line chart, Waterfall chart, 100% chart, Scatter and bubble chart, Annotations, Excel data links |
- The document creation process lacked efficiency in visualization.
- Creating charts took half an hour of the two-hour document creation process.
- Embedding Excel’s charts in PowerPoint was making the file large and slow.
- Able to create professional charts by using think-cell which is integrated within PowerPoint.
- Able to use think-cell without having to attend training or read a manual.
- Using think-cell, the team shortened the presentation creation process massively.
- think-cell's Excel data link feature has made data updates in presentations smoother.
The Intelligence Department researches customer insights and markets. 95% of the documents are created in PowerPoint

Contributing to the management decision-making process
ー Could you tell us about the mission and work of the Intelligence Department?
Mitsutake:Our mission is to analyze the Japanese market, customer insights, and changes in customer preferences, and to report on the information necessary for our company’s medium to long term growth.
In our day-to-day work, for example, we collect and organize POS (point‐of‐sale) data showing sales performance by product, survey data and then add our own analysis and interpretation of market trends to this and summarize the results in reports.
ー How are the reports created by the Intelligence Department used within the company?
Ashida:Around 95% of the reports produced by the Intelligence Department are created in PowerPoint. The reports are used in a variety of situations, for example, as a basis for discussion within the company, circulated to other departments to convey the latest information, and used in management meetings to discuss company-wide decision-making.
For this reason, we place importance on including quantitative and correct data, and on making the format easy to understand for the people who use the reports.

It used to take 30 minutes to create charts for a two-hour document. We also had trouble with the Excel link in PowerPoint.
ー What were the challenges you faced before you started using think-cell?
Ashida:The biggest challenge was that the visualization process in report creation was not very smart. The default PowerPoint features were not very customizable, so making charts was time-consuming and laborious. For example, the size of the chart and the size of the text were unbalanced and hard to read. It was difficult to change the scale in the graph, and it was hard to insert arrows that were important for comparing before and after.
To give one example, the reports used for regular meetings have a fixed design and structure, so we would replace the data in the charts with the latest information and add analysis and suggestions. However, when I updated the data, the format would break, so I had to fix the charts and re-add the arrows.
ー What were some other issues?
Ashida:The charts used in the reports for regular meetings are linked to Excel. The connection itself is fine, but if we keep adding data for a while, the data size will increase and it will take longer to update the charts. This meant that even if I was just moving the charts around a little or modifying the design, I would have to wait for the processing to be done, and I found this very stressful.
We can use think-cell to create documents without needing a manual or training.

Building better business charts
ー How did you know about think-cell?
Mitsutake:The JT Group started using think-cell about 10 years ago, while the Intelligence Department started using it about 7 to 8 years ago. I heard that it was introduced to employees of our group companies working overseas who later brought it to our head office in Japan.
It was first used by the finance and IR department, then introduced to our Intelligence Department. As of today, think-cell is widely used across JT Group.
ー What was your first impression of think-cell?
Ashida: I began using think-cell shortly after transferring to the Intelligence Department. Working outside the head office, I’d always wondered why their reports were so well-organized, transferring there gave me the answer.
I didn't have to go through any training or read any manuals. In fact, I've never seen any other employees asking around about how to use think-cell.
I remember that the first report I created with think-cell was a weekly report for use within the Intelligence Department. I found it very convenient because I could simply update the data in the charts created by my seniors using think-cell and the charts were complete.
We use different charts and, Excel and BI tools to link data to charts.
ー With think-cell, anyone can create a variety of charts. Could you tell us which ones are particularly popular?
Ashida:In order of popularity, we use the following six charts most often.
・Stacked column and bar char
・Pie and doughnut chart
・Line chart
・Waterfall chart
・100% chart
・Scatter and bubble chart
ー How do you customize each of these charts?
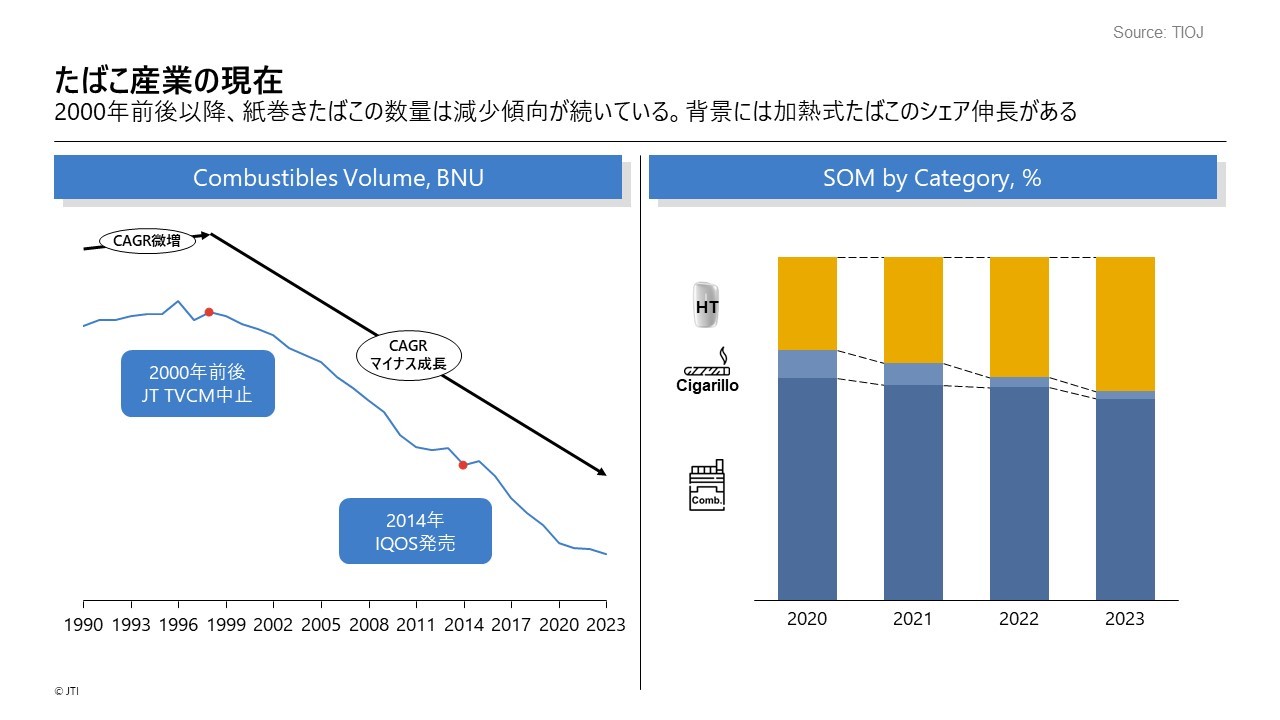
Ashida:With Line chart, it's useful that I can add color to the points where the line bends. For example, if I’m making a graph to show changes in consumer trends, I can easily show where major changes have occurred. Also, the fact that I can add the average change rate with the click of a button is highly rated in terms of being able to visually convey trend changes to the people who receive the report.
One of the things I do when creating charts other than Line chart is to hide the numbers on the axes in the chart. I try to remove any information that is unnecessary for the message I want to convey, and display and emphasize the numbers I want to convey.
In the Intelligence Department, I often create reports that compare data over time, and in these cases, difference arrows are very useful.
When I was creating reports using only PowerPoint, I selected the arrow shape from the "Insert > Shapes" tab, and then changed the color and shape of each arrow and pasted them on the chart. Various types of arrows, such as level difference arrows and total difference arrows, are implemented in think-cell by default, and it is quite convenient that they are inserted into the chart simply by selecting them. What's more, if I resize the chart itself, the arrows will also resize accordingly, so I don't have to go through the hassle of doing it manually.
Mitsutake:I particularly make use of think-cell's Excel data link feature. This feature allows me to create charts directly in PowerPoint from data in Excel, which enables accuracy in my charts. Thanks to this feature, it no longer takes a long time to update the data depending on the size of the data. Of course, I don't feel stressed anymore.
Also, I disconnect the data link to Excel just before submitting the completed reports. This is a way to prevent data from being changed or lost due to some kind of mistake, and I think it is also convenient that you can turn off the link with multiple Excel files at once.In addition to Excel, there is also a feature that allows you to specify Tableau, the BI tool, as a data source, and I am considering using it in the future.
We can't go back to the way things were before we introduced think-cell. Making a graph that used to take 30 minutes now only takes a few clicks.

Chart creation made easy
ー How has think-cell impacted your work?
Mitsutake:We can't go back to the way things were before we introduced think-cell. If we were to create reports without think-cell, it would take a lot of time and effort to create a new report each time.
Before, it took me 2 hours to prepare a report for a regular meeting, and I spent 25% of that time, or half an hour, on modifying the charts. With think-cell, I can do this in a few clicks, or in a few seconds. The time I save can be used for thinking about suggestions and analysis. I have to work fewer overtime hours.
Ashida: By reducing the amount of time spent on simple tasks like making charts, we have more time to test hypotheses and ideas.. We test each hypothesis, and the more hypotheses we can test, the more varied the content of our reports will be. It is unknown how much impact these hypothesis tests will have on management, but I hope that we can contribute to management decision-making in some way.
As a strategic advisor to the JT Group, I would like to continue to use think-cell for my analytical work.

ー Could you give us a summary of your report creation using think-cell and tell us about your future plans?
Mitsutake:If think-cell were to be described in another way, it would be “the time-creating tool.” I think think-cell is not just a convenient add-on tool for PowerPoint, but a solution that reduces the time you spend moving your hands while creating meaningful time for you to use your brain.
I would like to continue using think-cell to create reports in the future. The markets we target and the preferences of our customers are constantly changing. I would like to continue working on analysis as a better strategic advisor so that I can always understand these changes and use the analyses to help the company grow.
ー What kind of companies would you recommend think-cell to?
Ashida: I think think-cell is a good solution for any company that needs to create reports with charts, regardless of company size.
I think that small companies in particular, where one person has to tackle a variety of tasks, will benefit from the time they can save on creating documents. On the other hand, for companies with multiple group companies like us, I think there are benefits to be gained from rolling out the tool across the organization to improve efficiency.
Experience the same transformation in your presentations
- No credit card needed
- Unlimited access to all think-cell Suite features
- Automatically expires after trial duration
Explore this topic further with AI:
Read more

Hear how the Vaillant Group, world market leader in central hydronic heating units. uses think-cell to boost the efficiency of their financial reporting processes.

Discover how IRPC’s Corporate Strategy team leveraged think-cell to enhance presentation quality, streamline report creation, and improve strategic decision-making within the company.

Discover how NTT DATA INSTITUTE OF MANAGEMENT CONSULTING, Inc. enhanced report creation efficiency and improved decision-making by leveraging think-cell.