What's in the think-cell Suite?
Explore think-cell Suite products
The think-cell Suite is a set of products that integrate seamlessly into PowerPoint, helping you create stunning charts and presentations, quickly access presentation resources, automate your reports by connecting to data sources like Excel, and ensure your work always stays on brand.
You can read about the features included in each product on this page.
Convinced?
think-cell Core
Deliver presentations faster with a set of powerful tools that support productivity and consistency. Structure presentations in real-time with dynamic agenda slides and convey your messages more effectively with intelligent building blocks.
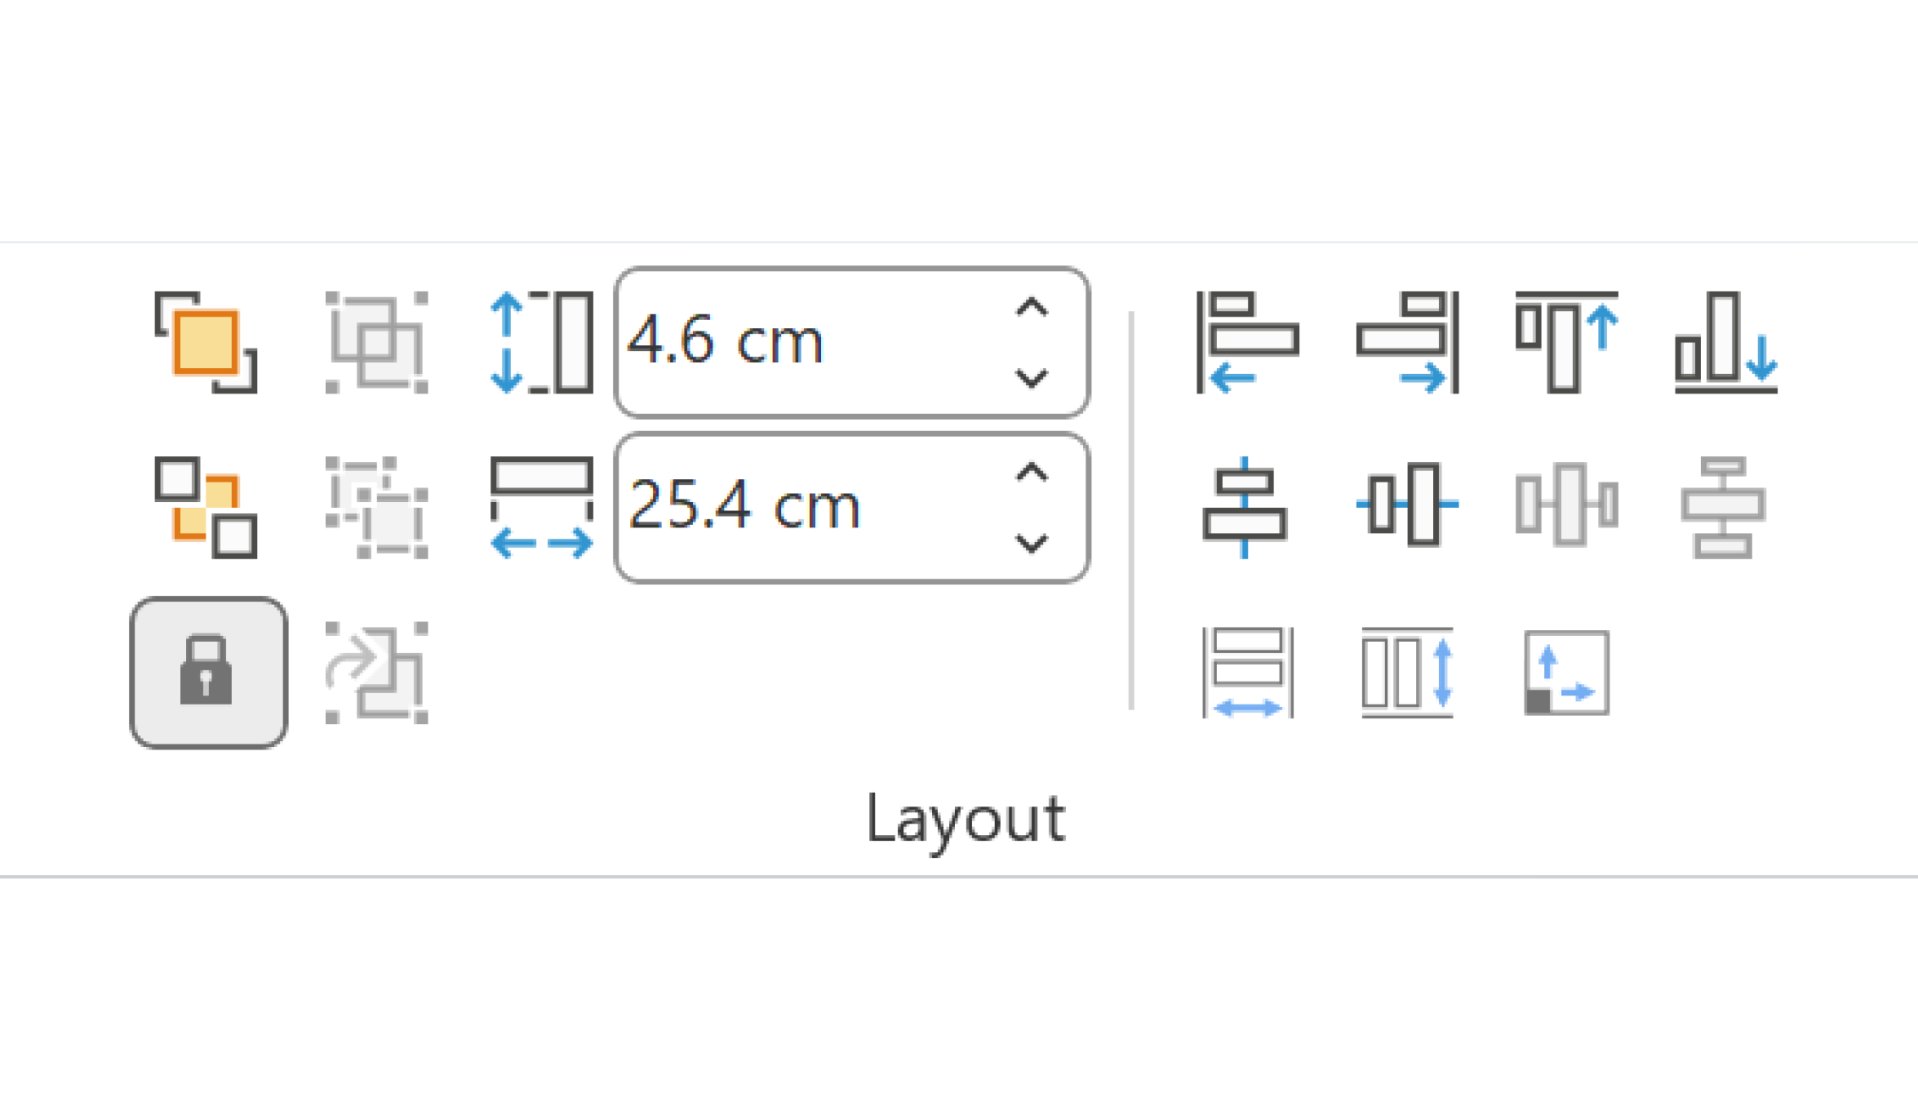
Align and resize
Quickly and accurately adjust the alignment, position, and size of elements to ensure a polished presentation layout.
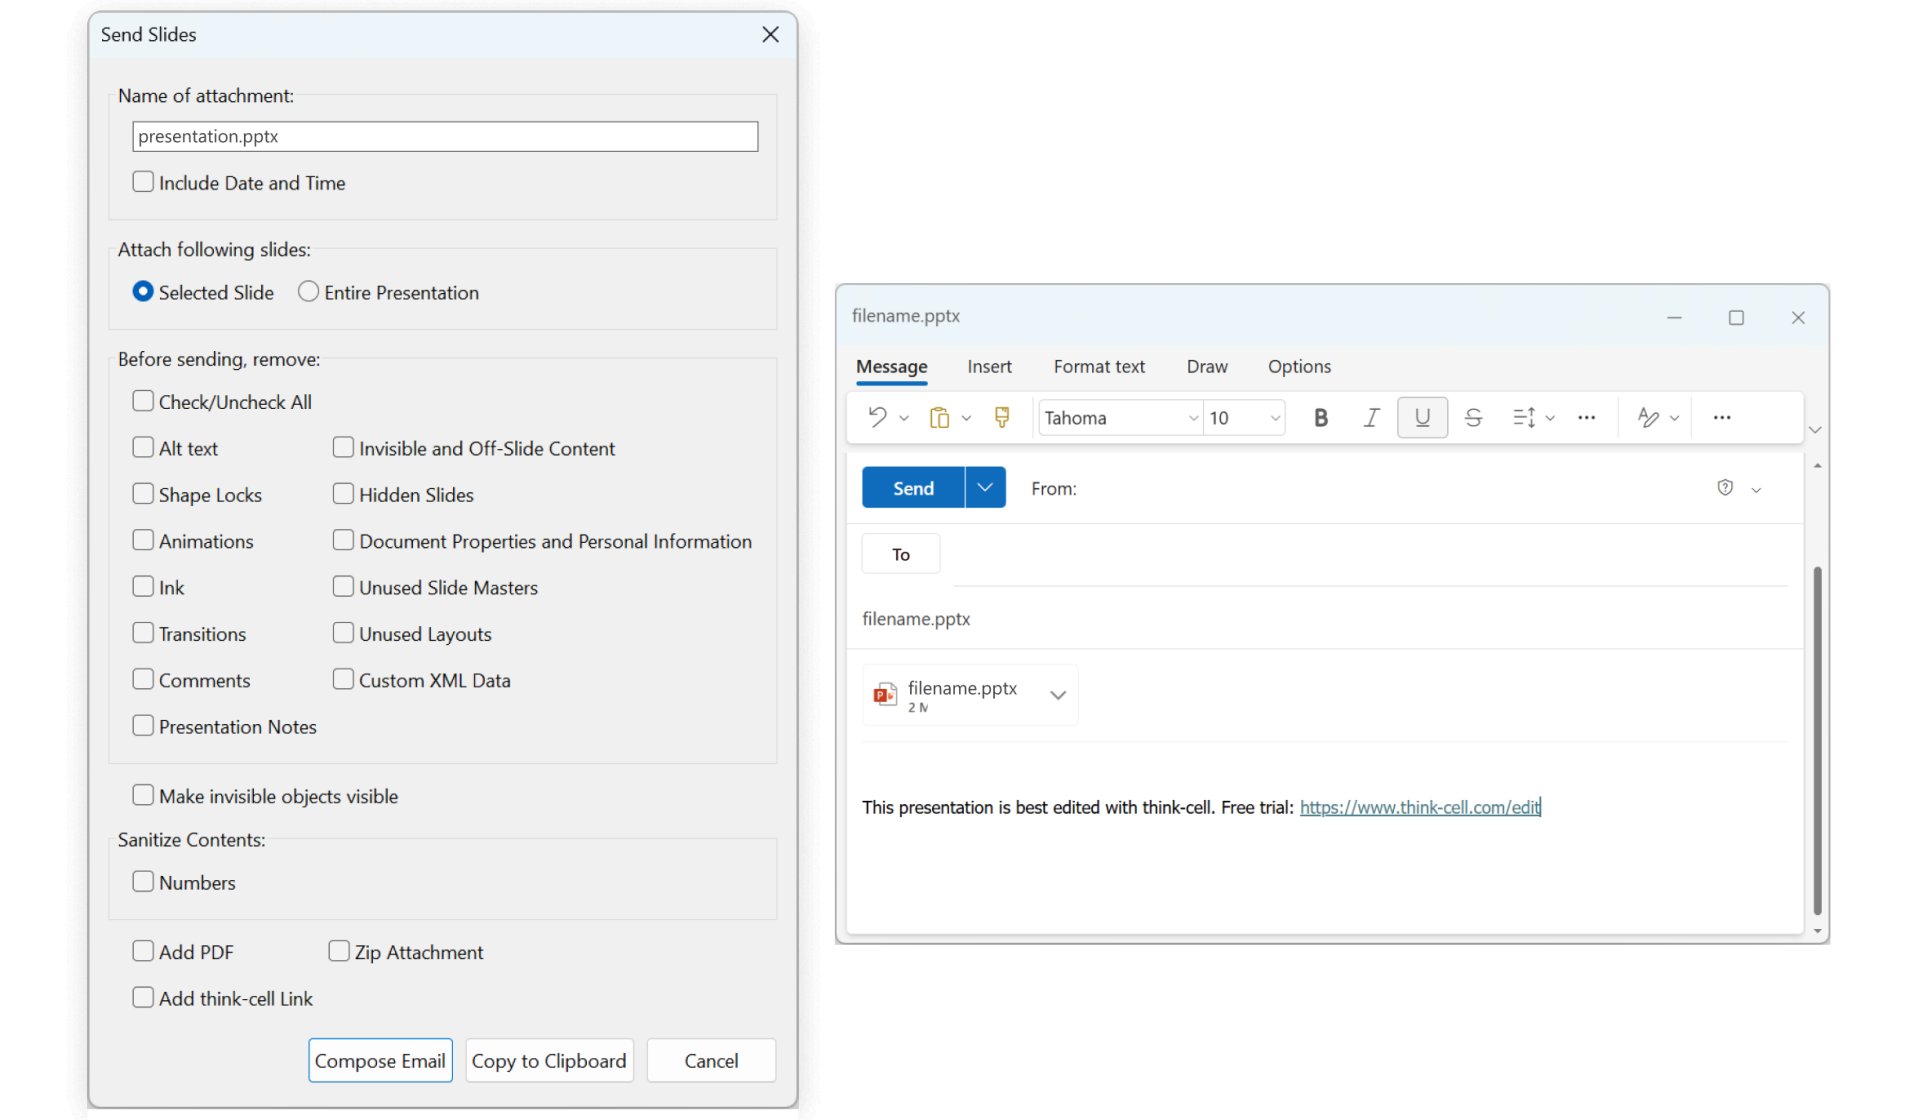
Save or send slides
Save a copy of selected slides or the entire presentation, copy the file to your clipboard, or send it via email. At the same time, choose to clean up and sanitize the slides.
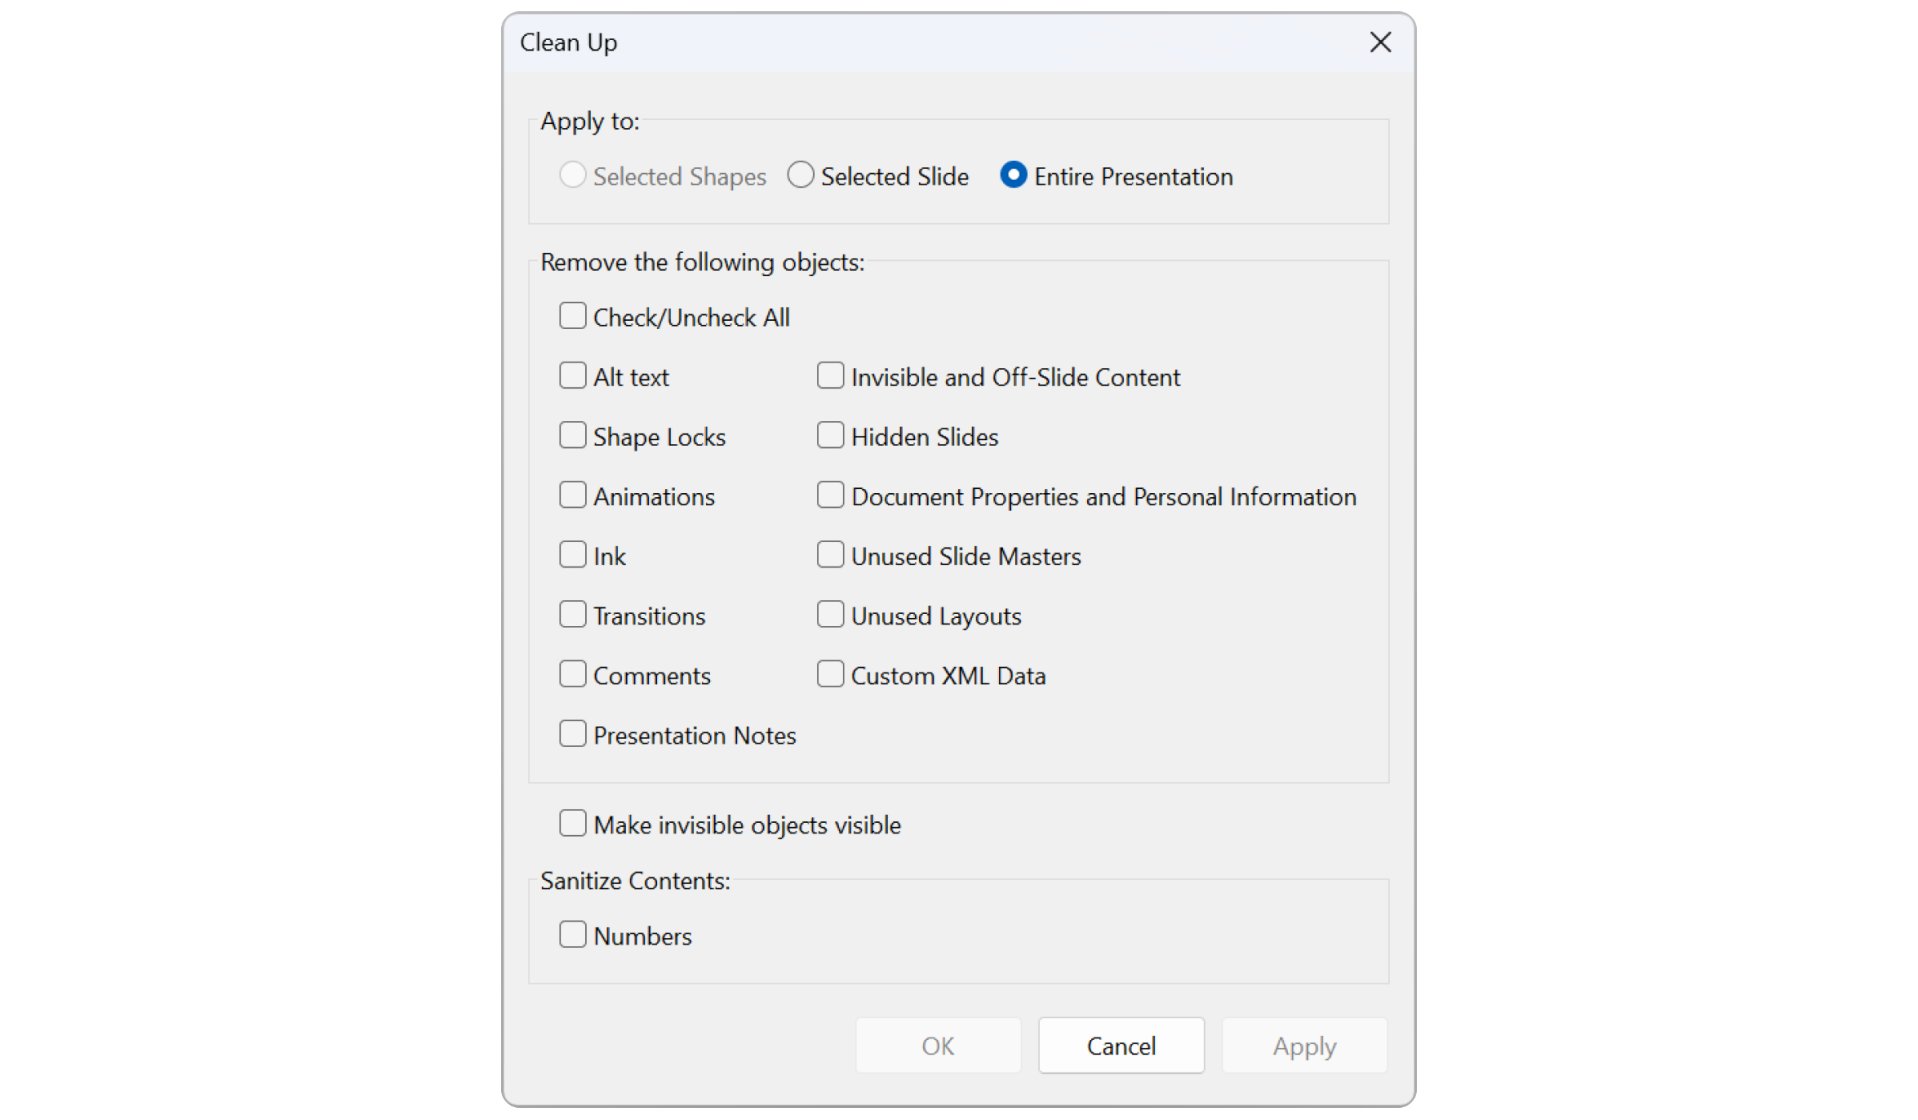
Clean up and sanitize
Remove sensitive information, comments, and other unwanted content to ensure your presentation is professional and secure.
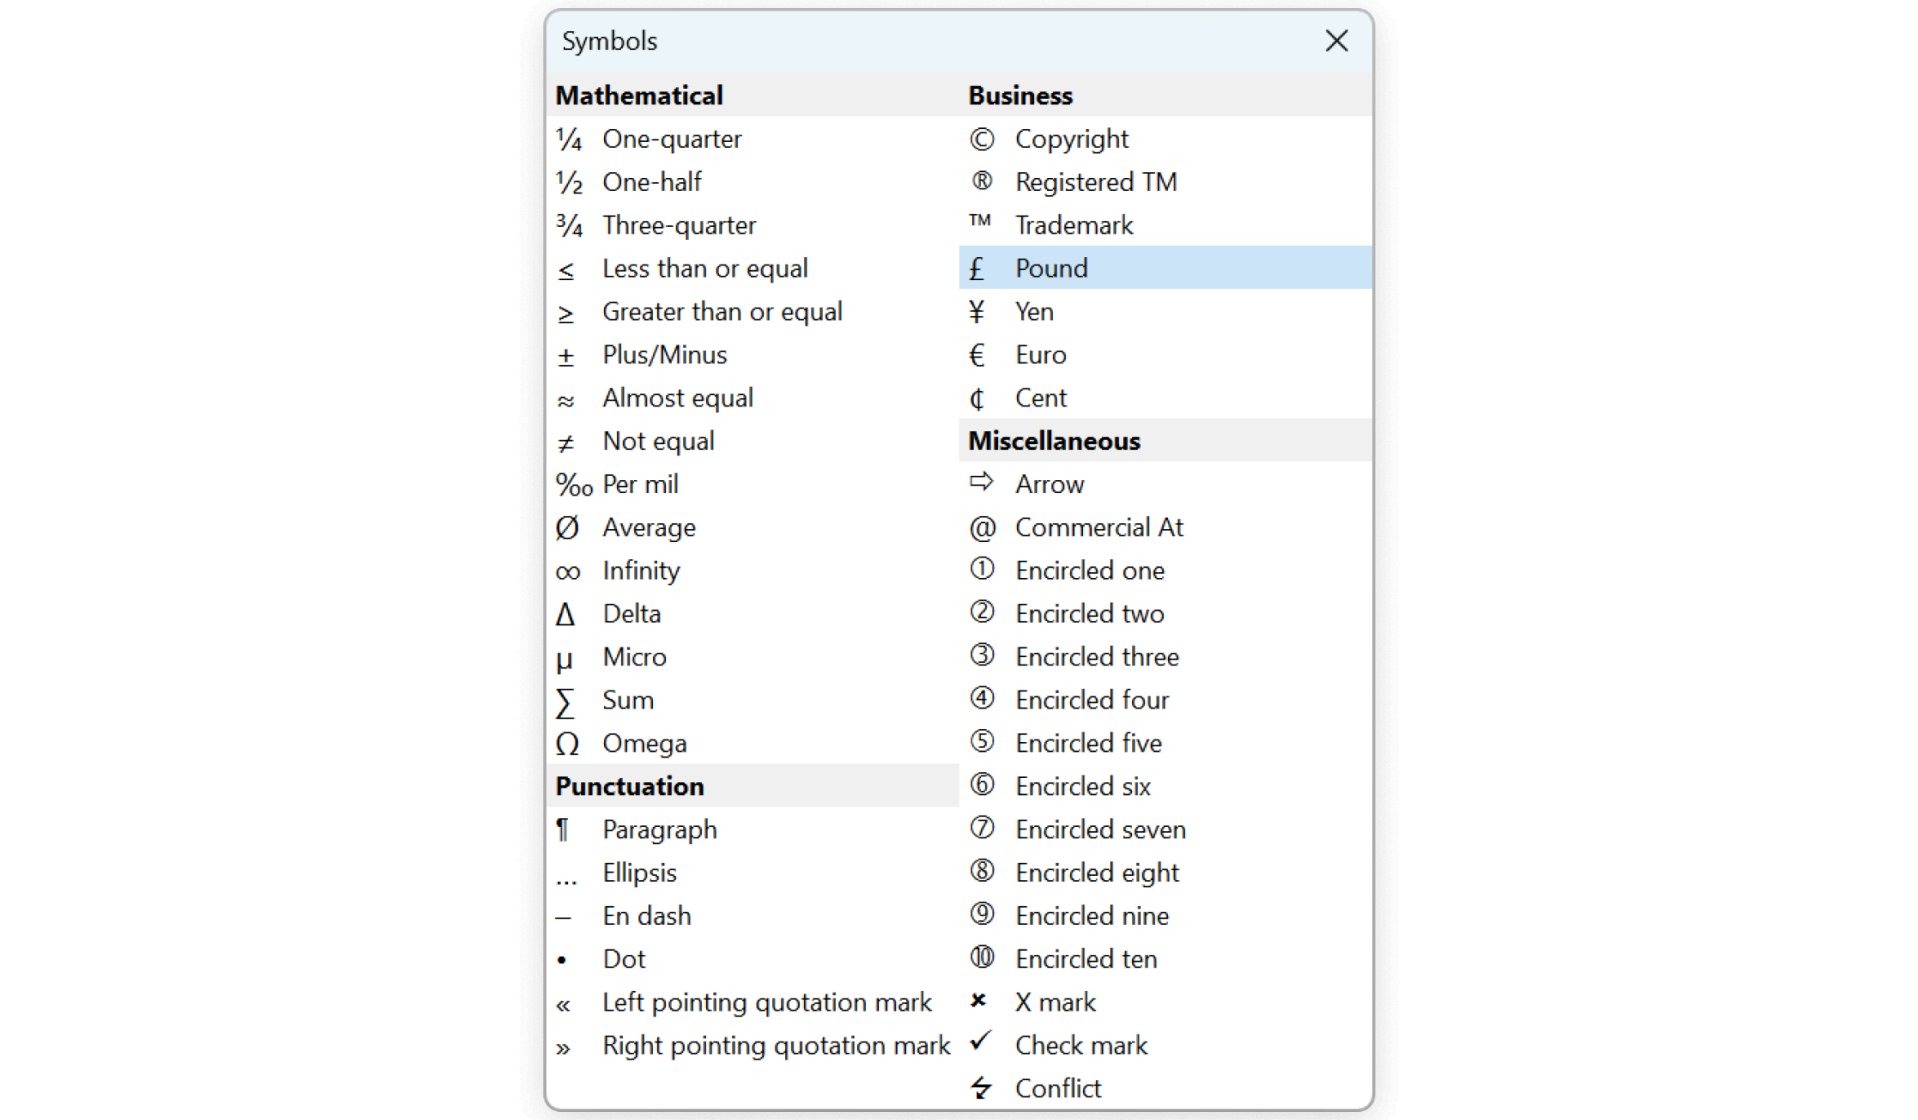
Insert symbols
Find the symbols and special characters you actually need with fewer clicks.
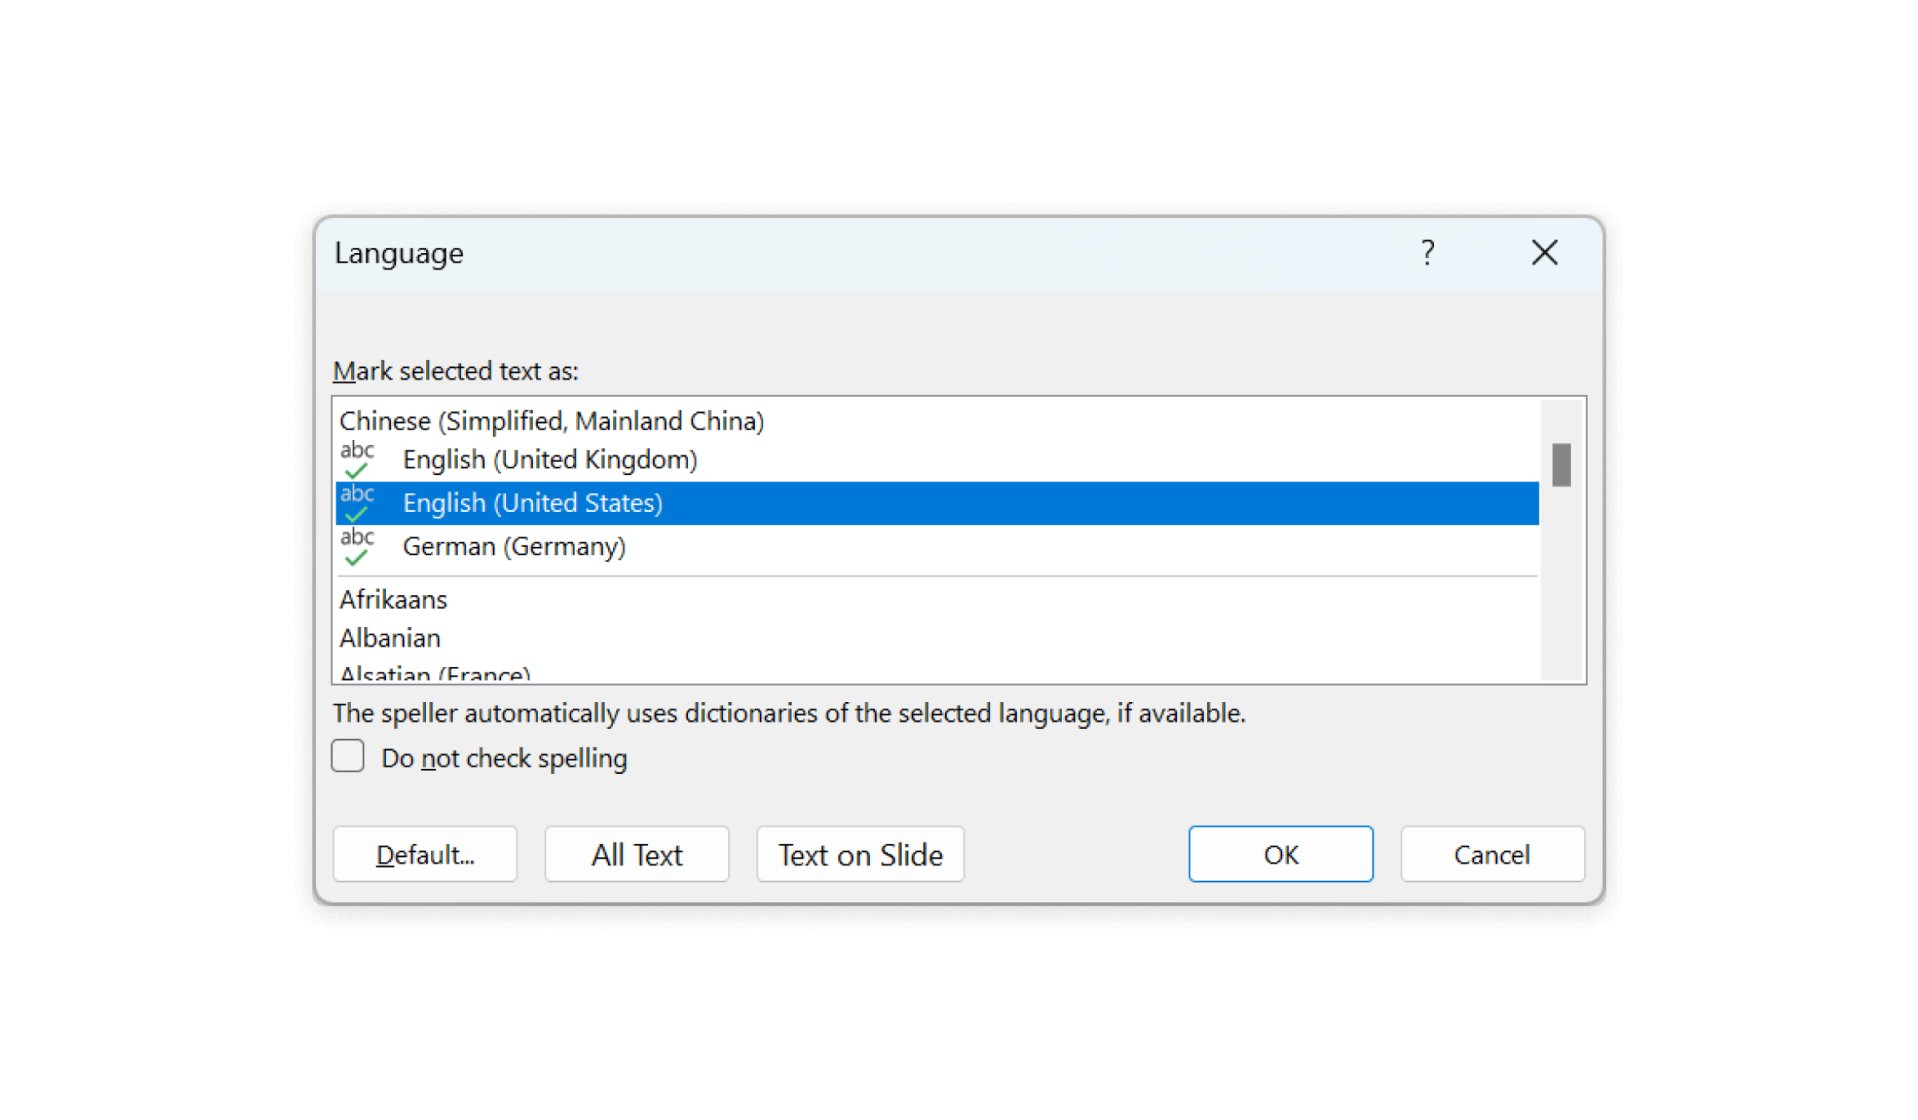
Change proofing language
Choose the proofing language for selected objects, slides, or the entire presentation. Ideal for international presentations.
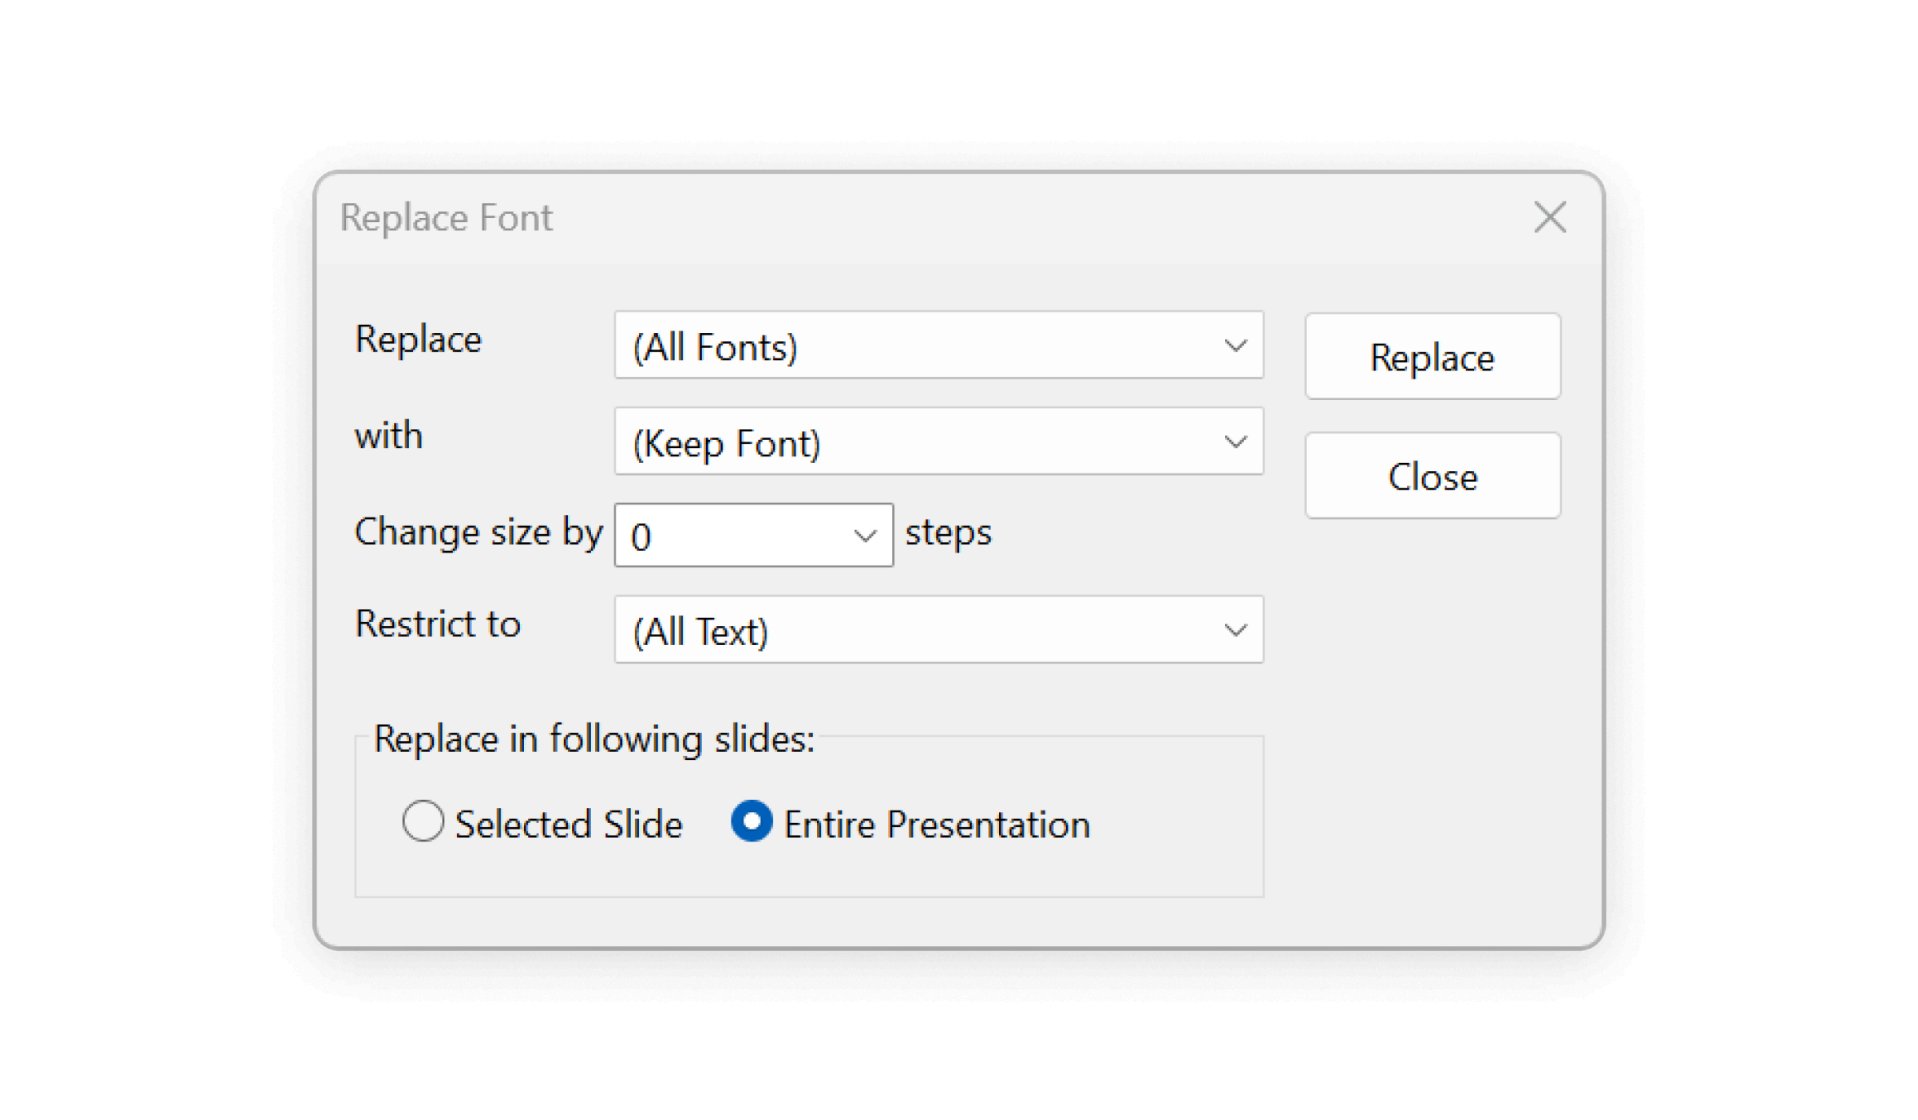
Replace and resize fonts
Replace or resize fonts for selected slides or entire presentations to maintain a cohesive and readable design.
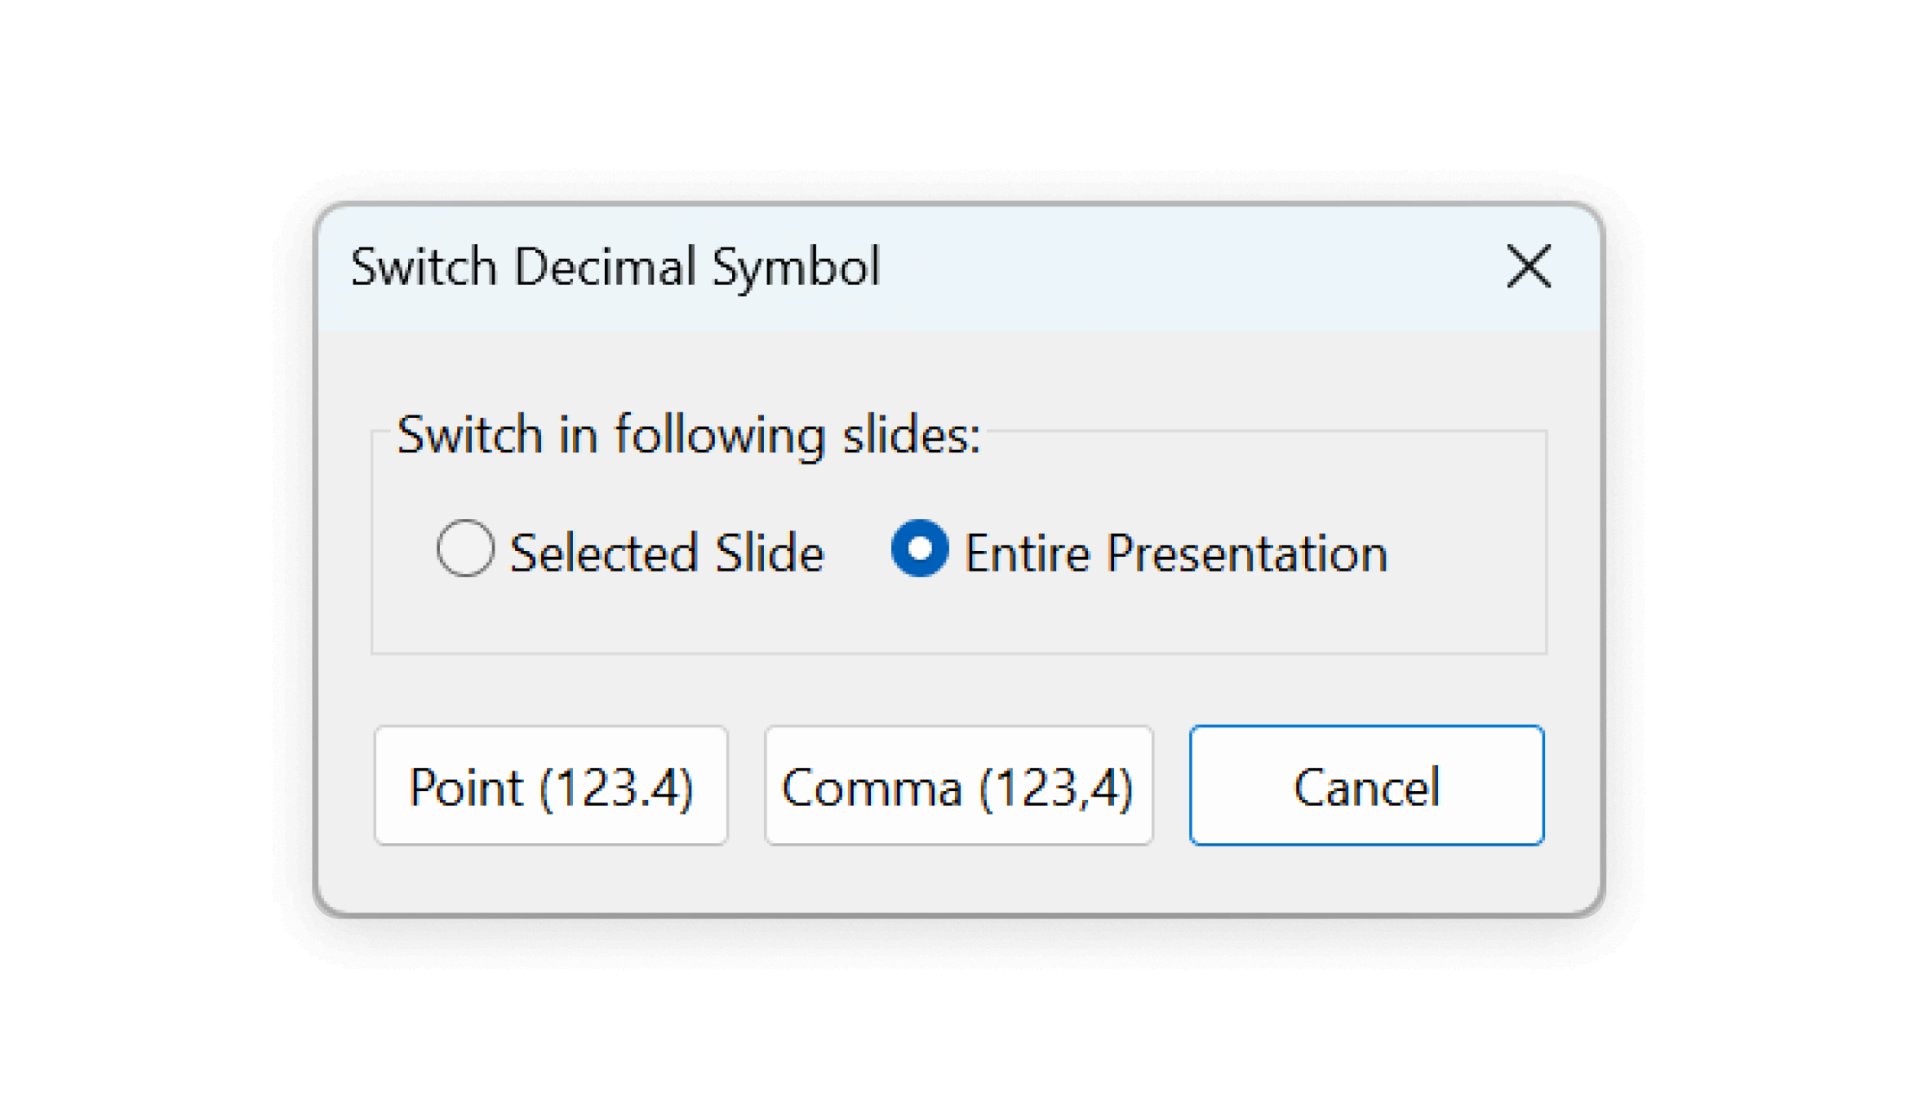
Switch decimal symbols
Switch between periods and commas as the decimal point to ensure accuracy and consistency in international presentations.
(Re)structure your entire presentation in real-time
Add chapter slides to your deck, type in the chapter titles and think-cell will take care of the rest. Not only when you change titles, but also when you reorder your slides in the slide sorter, the agenda will be automatically updated. In slide show mode, the table of contents as well as every chapter slide can be used for non-linear slide navigation by a simple mouse click.
Use intelligent building blocks to convey your message
Leverage smart text boxes with automatic size and position adjustments for an even layout.
Facilitate decisions with clear process visuals
Create process flows with pentagons, chevrons and textboxes that automatically adjust their size and formatting.
Use dynamic elements for structured evaluation
Create Harvey balls with unlimited divisions and link to Excel data for always up-to-date information. Visually represent statuses with check boxes and easily switch between check, cross, or blank states.
Integrate your brand language into think-cell
Create style files based on your brand design to standardize fonts, color schemes, and more. Avoid manual formatting by aligning all think-cell elements with your brand standards by default. Create multiple style files to support individual brand designs for different regions, departments, or brands with multiple style files.
think-cell Library
Discover the content you need faster than ever. Search your entire PowerPoint repository at slide-level, access premium templates, images, and icons. Simply connect any existing folders you like to the library and start searching. Keep your documents secure as they remain in their original location. think-cell respects permissions and does not copy or upload your files to the cloud.
Search and reuse all your presentation assets
Efficiently search your presentations at the slide level directly in PowerPoint. Find the best results with highlighted search terms and detailed previews. Refine your search with powerful filters for precise results.
Get started by simply connecting your existing folders to the library, without needing a server installation.
Use professional templates for instant impact
Jumpstart your presentations with a curated selection of high-quality templates designed to meet diverse needs. Use ready-made visualizations and frameworks to deliver your message with a polished, professional look.
Discover stock images and icons at your fingertips
Access millions of professional free stock images and icons directly within PowerPoint or connect to your existing digital asset management platforms. Enhance your presentations with relevant visuals to make your messages more impactful.
Integrates with:

think-cell Charts
Access over 40+ charts to tell your story. Create visually stunning and more insightful management-style charts quicker.
Waterfall charts
Create waterfall charts with multiple stacked segments, auto-calculated (sub)totals, and segments crossing the baseline. Modify waterfall charts to create funnel charts.
Bar and column charts
Create stacked, clustered or 100% column and bar charts with automatically formatted labels, axis breaks and category gaps. Modify stacked column charts to create butterfly or tornado charts.
Line and area charts
Create line, area and area 100% charts with advanced options such as a secondary value axis, interpolation and error bars. Modify line charts to create candle stick (stock price) charts or football field charts.
Pie and doughnut charts
Create pie and doughnut charts with rotatable and detachable slices, connectors. Modify pie and doughnut charts to create gauge charts, pie of pie charts, bar of pie charts, and concentric doughnut charts.
Scatter and bubble charts
Create scatter and bubble charts with auto-placed point and bubble labels with intelligent z-order to avoid hidden bubbles, advanced auto-calculated trendlines and customizable partitions and fill areas.
Mekko charts
Create Mekko charts with a unit axis or a %-axis, varying segment widths to show the relative importance of each category and easily combine several small segments into an ‘Other’ segment without manual calculations.
Combination charts
Create combination charts with stacked columns, bars or lines for different data sets, segment breaks and a secondary value axis for different scaling. Modify combination charts to create box and whisker charts, candle stick (stock price) charts, and pareto charts.
Outline and track projects with a best-in-class Gantt chart
Configure the timeline with automatic calendar scale for day, week, month, quarter, (fiscal) year and formatting for weekends. Simply add and adjust activity bars, chevrons, or milestones. All timeline items adjust accordingly when the chart is resized or when items are added or removed for the best visual presentation.
Bring your tabular data to life with dynamic Excel-based tables
Convert numerical text to visual elements and allow your audience to better process data. Build and adjust table data quickly with our Excel powered tables. Avoid error-prone manual updates and calculations with data automation features.
Ensure accuracy and consistency across reports
Link Excel data to all think-cell charts, tables, smart elements, and even PowerPoint text. Maintain data consistency in your reports with full control over updates. Enjoy robust connections even when files get moved or renamed.
- Highlight linked elements on slide for visibility
- Edit datasheet layout to fit your data
- Update manually or automatically whenever data changes
Connect your think-cell charts to Tableau
Connect think-cell charts and tables directly with data from Tableau dashboards. Maintain full control of your updates with a single click. Annotate fully functional data-driven charts, even without an active connection or access to Tableau.
- Highlight linked elements on slide for visibility
- Works with both on-premise and cloud hosted versions of Tableau
- Simple setup via think-cell browser extension
Automate from any data source through the think-cell API
Utilize our think-cell API to populate individual think-cell elements or even entire predefined presentation templates programmatically. Pull data from any source that supports exporting data in JSON. Modify fully functional think-cell elements after creating automated if refinement is needed.
Extract data from chart images
With think-cell you can extract numerical data and category labels from any column and bar chart image. It not only recognizes simple column and bar charts, but also stacked ones. Start the extraction process either from think-cell internal datasheet or directly from Excel. Move the transparent extraction window over your chart image, hit import and the chart's data and labels will appear in your Excel sheet.
Works with
Windows
Windows 11
Windows 10 32/64
Windows 8.1 32/64
Windows 8 32/64
Windows 7 32/64
Office 365 Fully Installed
Office 365 Click-to-Run
Office 2024 32/64
Office 2021 32/64
Office 2019 32/64
Office 2016 32/64
Office 2013 32/64
Office 2010 32/64
Mac
macOS High Sierra (10.13)
and later
Office 365 Fully Installed
Office 2024 for Mac
Office 2021 for Mac
Office 2019 for Mac
Office 2016 for Mac
