The ultimate guide to creating PowerPoint timelines
19 min read — Akash Choudhary
Timelines are an effective way of visualizing processes, such as historical milestones, product roadmaps, or project plans. PowerPoint is often the go-to tool for creating timelines, yet different types of timeline can have different purposes, and PowerPoint might not always be the best option.
This guide will help you understand what to consider when creating a timeline, show you how to choose the right tool for the job, and explain how you can get the most out of PowerPoint when making your timelines. More specifically, the guide covers the following points:
If you are making a timeline as part of a bigger presentation that you are already building in PowerPoint, then it is the path of least friction to create your timeline directly within the software.
The native capabilities of PowerPoint are most suited to illustrative timelines. You can use tables, shapes, smart graphics, and icons however you like. Combining these elements—together with the ability to insert images from other sources—gives you a wide range of possibilities for building attractive timelines to help tell your story.
PowerPoint even offers a range of pre-supplied timeline templates which anyone can access by selecting ‘New’ from the File menu and typing timeline into the search field.
Disadvantages of making timelines with PowerPoint
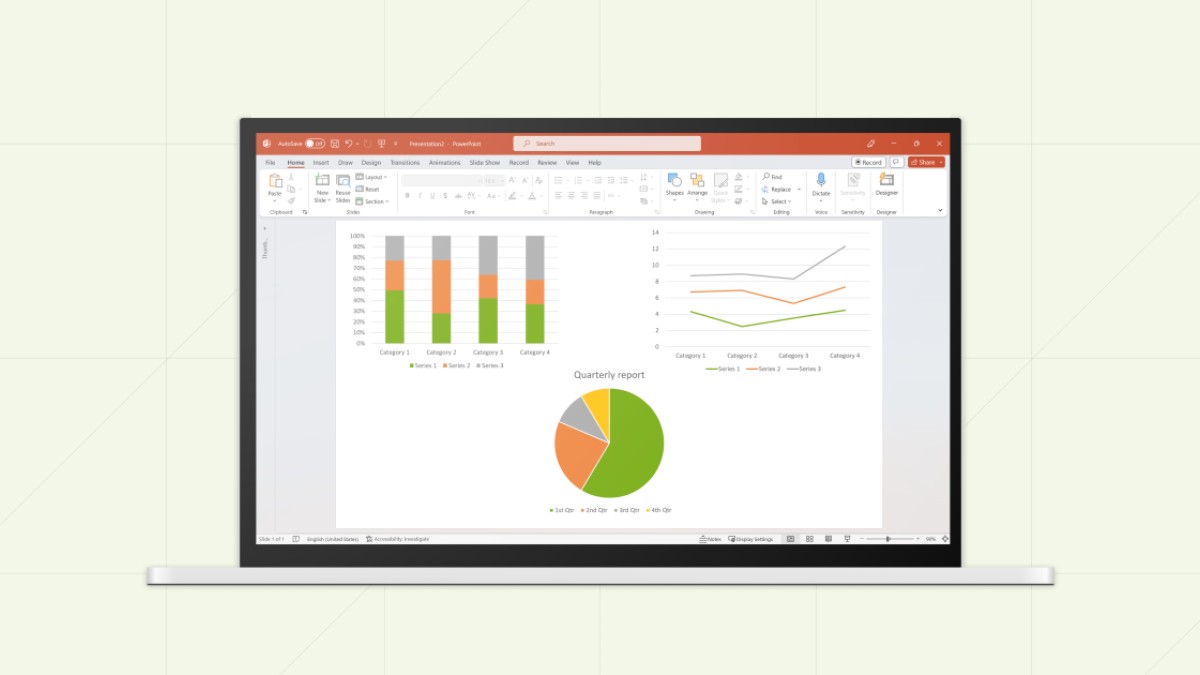
Most PowerPoint diagrams, even complex ones like waterfall charts, can be linked to a datasheet or Excel spreadsheet, meaning that the PowerPoint charts can update automatically if the data changes.
This doesn’t work for timelines. In fact, the primary disadvantage of making planning timelines with PowerPoint is that they tend not to be connected to a calendar or any other data source. This means that you have to update them manually if there are any changes.
There are also issues with illustrative timelines, even though these don’t normally need a connected data source. While it is possible to create attractive timelines in PowerPoint, they are usually difficult to edit as they rely on custom shapes or drawings.
Take the product roadmap shown above (left). If you wanted to add a ninth element at the end—such as evaluation—you would have to resize, rebuild and redraw almost the entire template. You can’t easily add, remove or reorder elements, making templates like this more a source of inspiration than of significant practical value.
PowerPoint alternatives: Different options for creating timelines
Given the limitations associated with making timelines in PowerPoint, it’s not surprising that users often look to other options—and that many businesses have entered the market with alternatives that aim to solve some of PowerPoint’s most pressing issues.
For illustrative timelines that are designed for one-off use, you can use almost any illustration software to create a static image and copy it into PowerPoint. Planning timelines that need regular updating via a data connection are more complex. That’s why here we’ll look at two options for planning timelines: Microsoft Excel and one of the many web-based task management tools.
Building timelines in Microsoft Excel
Excel will often be the first place people used to working in the Microsoft ecosystem will look for any chart or visualization that is built around data. The data points relevant for planning timelines most commonly include:
dates
task lengths
task completion percentages
Excel has the advantage that any chart can be easily copied into a presentation and synced with PowerPoint. However, if you navigate to the Insert tab within Excel and click Charts, you will quickly realize that there are no in-built options for timelines.
This becomes even more evident if you look at the timeline templates available within Excel for new presentations, which come in two general styles:
The left-hand option is essentially a table which lets you add dates and costs, and also includes data validation within cells to help you assign tasks and set statuses. Table views like this are hard to read, and a long way from any timeline visualization you can easily work with to get a clear overview of the project.
The template on the right is an attempt to create a Gantt-style project plan. As this functionality doesn’t exist in Excel, it relies on workaround solutions that are unintuitive, easy to break, and don’t result in clear or aesthetically appealing outputs.
Although it looks like a project plan, the example shown is technically built using a scatter chart that adds error bars to the data points to represent the task durations. It’s not hard to see why building timelines with hacky solutions like this is an unsatisfactory experience, hard to scale, and produces outputs far below the standard expected of a professional presentation.
Web-based task management tools
Many companies and teams choose to work with one of the countless web-based task management tools that are currently available. The precise functionalities of these tools vary slightly, with some having a focus such as software development, and others aiming to appeal to a broader audience.
All these task management tools offer some kind of timeline visualization that is synced to the data in the individual tasks and is often customizable in different views, such as burn-down charts for development sprints.
While these tools can be extremely valuable in helping teams manage their projects effectively, there are inherent disadvantages to using the built-in project timelines for visualization purposes:
Access: Companies have to manage who can view, edit or administrate different areas of a platform, meaning that there can often be friction if trying to share a project timeline with an audience outside of the immediate team.
Control: Task management timelines can be fairly rigid in the available customization options, meaning that you don’t have full control over what you hide and what you display.
Information surplus: Timelines constructed from tasks are usually overloaded with details that are unlikely to be relevant for most audiences, making it difficult to easily digest what matters.
Environment: Working with a timeline in a web platform is fine when you are interacting with the tasks in that same tool, but as soon as you want to incorporate it into another environment, you usually have to rely on clunky embeds or screenshotting.
Layout and branding: If you do copy or export a timeline from a web-based tool into a PowerPoint presentation, the design won’t match the layout and visual style of the rest of the deck.
These drawbacks shouldn’t be seen as criticisms of the platforms. They simply stem from the fact that these tools prioritize task management functionality—as this is their core offering—over timeline visualization concerns.
Creating timelines in PowerPoint
If you do decide to create a timeline in PowerPoint, then—besides trying to construct a timeline completely from scratch—there are three main approaches you can take, which we’ll describe in more detail below:
SmartArt: Work with PowerPoint’s smart graphics for simple process diagrams or milestone timelines
Design template: Start with one of PowerPoint’s existing timeline templates and try to adapt it to your needs
PowerPoint add-in: Install a productivity add-in like think-cell that supports the creation of powerful Gantt charts and planning timelines
When I move companies, the first thing I ask for is think-cell. It helps me with everything— tables, charts, especially Gantt charts. Creating Gantt charts saves me so much time and makes sure everyone is aligned.
How to create a simple milestone timeline with PowerPoint SmartArt
PowerPoint includes a range of illustrations called SmartArt that let you edit text and elements within the graphic. These are most suited to creating a basic event timeline, milestone timeline, or process timeline.
Insert a timeline using PowerPoint SmartArt
Navigate to the Insert menu.
Select ‘Smart Art’ under the ‘Illustrations’ group.
Click on the ‘Process’ option, which will open a window with several graphics.
Look for the option called ‘Basic Timeline’ or ‘Circle Accent Timeline’. Select your preferred style. Once selected, it will auto-populate on the slide.
Add text and information to your PowerPoint milestone timeline
Once you have a SmartArt graphic on your slide, you can add valuable information to your timeline such as key dates, milestones, initiatives, and deliverables. You can use information hierarchy to ensure information is delivered clearly.
Options for editing your milestone timeline include:
Text can be typed directly into the text boxes appearing as [Text]
The Text Pane, whichappears to the left of the timeline, is linked to the text boxes. You can add additional texts, which will generate additional milestone bubbles on the timeline. When editing an existing, you can use Tab to create bullet points at different levels. Edits you make directly in the text boxes will also be reflected in the Text Pane.
When you have the SmartArt timeline selected, the SmartArt Design tab appears in the PowerPoint ribbon. Here, you can access full text editing functionality through the Create Graphic command group.
The available functions are:
Add Shape: Adds milestones to your PowerPoint timeline chart.
Add Bullet: Adds a sub-bullet to your selected text.
Text Pane: Gives you access to your Text Pane window to the left of your chart.
Promote/Demote: Shifts text hierarchy one level up or down (i.e., milestone, bullet, or sub-bullet).
Move Up/Down: Shifts the order in which information is shown.
Right to Left: Flips the direction of your timeline from left to right or from right to left. This will flip not just texts, but also other elements, including the arrow and the milestone bubbles.
Layout: Only available for certain SmartArt graphics. Grayed out for milestone timelines.
Style and format your PowerPoint timeline
With your information inserted, it’s time to customize your timeline. For example, you may want to change your chart style, colors, font, or shapes within your timeline. Here, you have a few options:
Individual shapes, like the arrow or the milestone bubbles, can be selected with the mouse and moved, resized or reformatted—either via the ribbon menus or the context menu that appears when you right-click an element
Format options applicable to the whole chart can be selected from the Home or Format tabs. Use these to change font colors or to edit the chart background.
Preset chart styles or alternative layout options can be selected from the options in the SmartArt Styles or Layout sections of the SmartArt Design ribbon tab.
While PowerPoint’s SmartArt graphics do provide some intelligent features, like adding shapes and text simultaneously and resizing elements to fit the chart area, they ultimately lack the flexibility needed for anything beyond a very simple milestone timeline.
How to create a timeline from a PowerPoint design template
Microsoft provides a seemingly endless library of design templates to help users get started with PowerPoint without having to build up their presentation from a blank canvas. Most available timeline templates are of a more illustrative nature, so we’ll focus on them in this example.
Choose a pre-existing timeline template
The easiest way to find a design template is to go to File, Newvia the PowerPoint ribbon and use the search bar to find relevant templates.
Navigate to the File menu.
Select ‘New’.
Enter a search term, like timeline (or something more specific like history timeline), into the search bar.
Browse the results for your preferred option, left-click and click “Create” to start a new presentation with the chosen design template.
Add information to the PowerPoint template
Most design templates include the following elements that you can edit:
Placeholders: Fortext or images, you can click to insert your content into the timeline in the correct place and with the predetermined styling.
Text boxes: Often populated with generic text like “Add slide title” or “Date”, you can edit these by adding meaningful information.
When trying to edit some text elements, you might find that they cannot be easily selected. This is normally because the element is part of the template’s Slide Master. To edit these, you can navigate to View and choose Slide Master from the ribbon.
Adapt the PowerPoint design template to the needs of your timeline
Editing templates isn’t always intuitive, which is why there is often a link to a short set of editing instructions included in the presentation. However, there are several challenges when working with timeline templates in PowerPoint:
Lack of flexibility: Most templates are pre-designed with a fixed number of milestones or stages. If you want to add or remove a stage, your options are highly limited.
Inconsistent construction: Each design template is unique, so there is always a certain learning curve when working with a new template before you understand how it is put together.
Non-standard shapes:Templates often include illustrations created with custom shapes that may not be relevant to your timeline. You can easily change colors and sizes, but you may often have to delete the provided shapes and add your own shapes, icons or graphics.
Clunky editing: As templates tend to include a mixture of elements, some of which are on the slide and some are within the slide master, inconsistencies can occur when trying to change fonts, colors, or styles. You have to switch frequently between views to make sure you have all elements edited correctly.
No data behind planning timelines: Workingwiththe templates for Gantt-style project plans can be highly frustrating, as they require manual sizing and positioning of all objects. This makes simple tasks like adding rows extremely cumbersome and liable to errors.
This all means that you should always pick the template that is as close as possible to the timeline you are trying to make—and even then you should be prepared to encounter issues. Design templates are a useful showcase demonstrating what is possible with PowerPoint, but they are limited in terms of practical or scalable use.
How to create a project timeline with a PowerPoint add-in
Project timelines, also known as Gantt charts, calendar timelines, or project trackers, differ from simple milestone timelines in that they allow for a more detailed visualization of a project and its plan, including activities, milestones, key dates, owners, and relevant comments.
PowerPoint’s SmartArt graphics and design templates don’t allow for flexible project timelines, so the best way to create this kind of visualization within PowerPoint is by using an add-in designed specifically for this purpose.
The number one PowerPoint add-in of this nature is think-cell, which—as well as offering a range of other chart types and features—lets you create and update detailed project timelines directly in PowerPoint.
Create your timeline
Download a free think-cell trial.
Gain access to all features of the software.
Follow the steps in this guide to create your timeline.
Insert a project timeline with your PowerPoint add-in
Once you’ve got think-cell installed in PowerPoint, you can get started by easily inserting a project timeline into your slide.
Navigate to the Insert menu.
Select ‘Elements’ under the ‘think-cell’ command group.
Select ‘Gantt/Timeline’ and position your chart on your slide.
Format and add information to your Gantt chart
A major advantage of using a PowerPoint add-in to build your project timeline is the underlying calendar. This means that all task bars and milestones are tied to specific dates, making the timeline not only highly accurate, but also far easier to update.
think-cell’s automations and intelligent algorithms remove the manual labor associated with editing project timelines, making it efficient and quick. As a rule of thumb, you right click to add, remove, or adjust features on your timeline, while you left click to style and format individual elements. For example:
Adjust the visible date range by right-clicking (or double-clicking) on the timescale at the top of your chart to access the chart ‘Calendar’ and adjust start and end dates.
Add or delete activities by right-clicking on the activity column section of an activity row and selecting ‘Delete’ or ‘Insert Row’.
Add timeline items such as activity bars or milestones by right-clicking on the timeline section of an activity row and selecting ‘New Bar’ or ‘New Milestone’. Dates for these elements can be adjusted with a simple drag-and-drop or through their respective ‘Calendars’.
Add activity owners or commentary by right-clicking on the activity column section of an activity row and selecting ‘Responsible’ or ‘Remark’.
Style and format chart elements by left-clicking on a given element for quick access to formatting commands like font, font size, color, and style.
For a quick overview of how easy it is to create a project timeline in PowerPoint using think-cell, you can check out this short video below. For a more in-depth guide to our Gantt chart capabilities, you can refer to our user manual.
Frequently asked questions about PowerPoint timelines
Here we answer some of the most frequently asked questions about PowerPoint timelines.
Why create a timeline in PowerPoint?
Timelines are a great way to help your audience visualize a roadmap. They are a powerful way to show milestones, goals, or deadlines in a way that everyone can understand. They offer a strong solution to structuring and time-bounding a process and communicating this structure to your audience.
How do I create a timeline in PowerPoint?
PowerPoint offers some simple options for creating a basic timeline, including illustrative SmartArt graphics and a library of timeline templates. If you are aiming to make a fairly simple milestone timeline, you may find that PowerPoint’s native capabilities are enough to meet your needs.
For more sophisticated timelines, particularly if they are tied to a calendar you can update, you should work with a PowerPoint add-in like think-cell that lets you build complex project timelines.
How do I access free timeline templates in PowerPoint?
Outside of creating your own timelines, you can also access predefined templates in PowerPoint. When you create a new PowerPoint document, you can either commence with a ‘Blank Presentation’ or with a template presentation. Searching for ‘timeline’ amongst these templates will give you a selection of editable timeline templates to use.
How do I best show a timeline in PowerPoint?
The type of timeline you should use depends on your needs. If you’re looking to simply show key dates and simple information in sequential order, then a simple illustrative milestone timeline will do. If you’re looking to build a detailed project plan, then you should consider a project timeline, also known as a Gantt chart or calendar timeline.
How can I make a vertical timeline in PowerPoint?
The process diagrams within PowerPoint’s range of SmartArt graphics include some vertical options. However, due to the horizontal format of PowerPoint presentations, a vertical timeline is normally not the best way of representing a process and making best use of the available space on a slide.
How can I show project progress in PowerPoint?
PowerPoint provides a number of templates for representing the progress of simple projects. You can find these under SmartArt in the Insert menu. The SmartArt diagrams use different combinations of linked shapes, arrows, and text boxes to represent process flows. These are most useful for depicting simple milestone-based processes.
To show the progress of a project in any kind of detail, you should use a PowerPoint add-in like think-cell that lets you build complex project plans.
How do I create a project timeline in Excel and link it to PowerPoint?
The most basic way of transferring an Excel-based project timeline into PowerPoint is by copying the data in Excel and pasting it into a PowerPoint slide, using ‘paste special’ to either paste it as an image or as an editable table. Alternatively, you can use the ‘Object’ command in PowerPoint to paste an editable image of your Excel project timeline in PowerPoint.
If you want to connect a think-cell Gantt chart to data in an Excel spreadsheet, you can refer to our user guide.
Waterfall charts in PowerPoint: Your step-by-step guide
Learn what waterfall charts are, why they are effective, and how to create them in Excel or PowerPoint to convince your audience and help your decision-making.
7 steps for creating great PowerPoint presentations
Learn 7 steps for making an effective PowerPoint presentation, including how to structure your story, lay out your slides and create clearer, more impactful charts.